Published
Synchrony Financial (SYF) Investment Report
Equity research report on Synchrony Financial (NYSE: SYF), covering its business model, credit performance, funding and liquidity, valuation, capital returns, and principal risks.
Full report
Figures, tables, and analysis
The original report layout is reproduced below. Select any page to open it at full resolution.
Page 1Investment recommendation and valuation overview 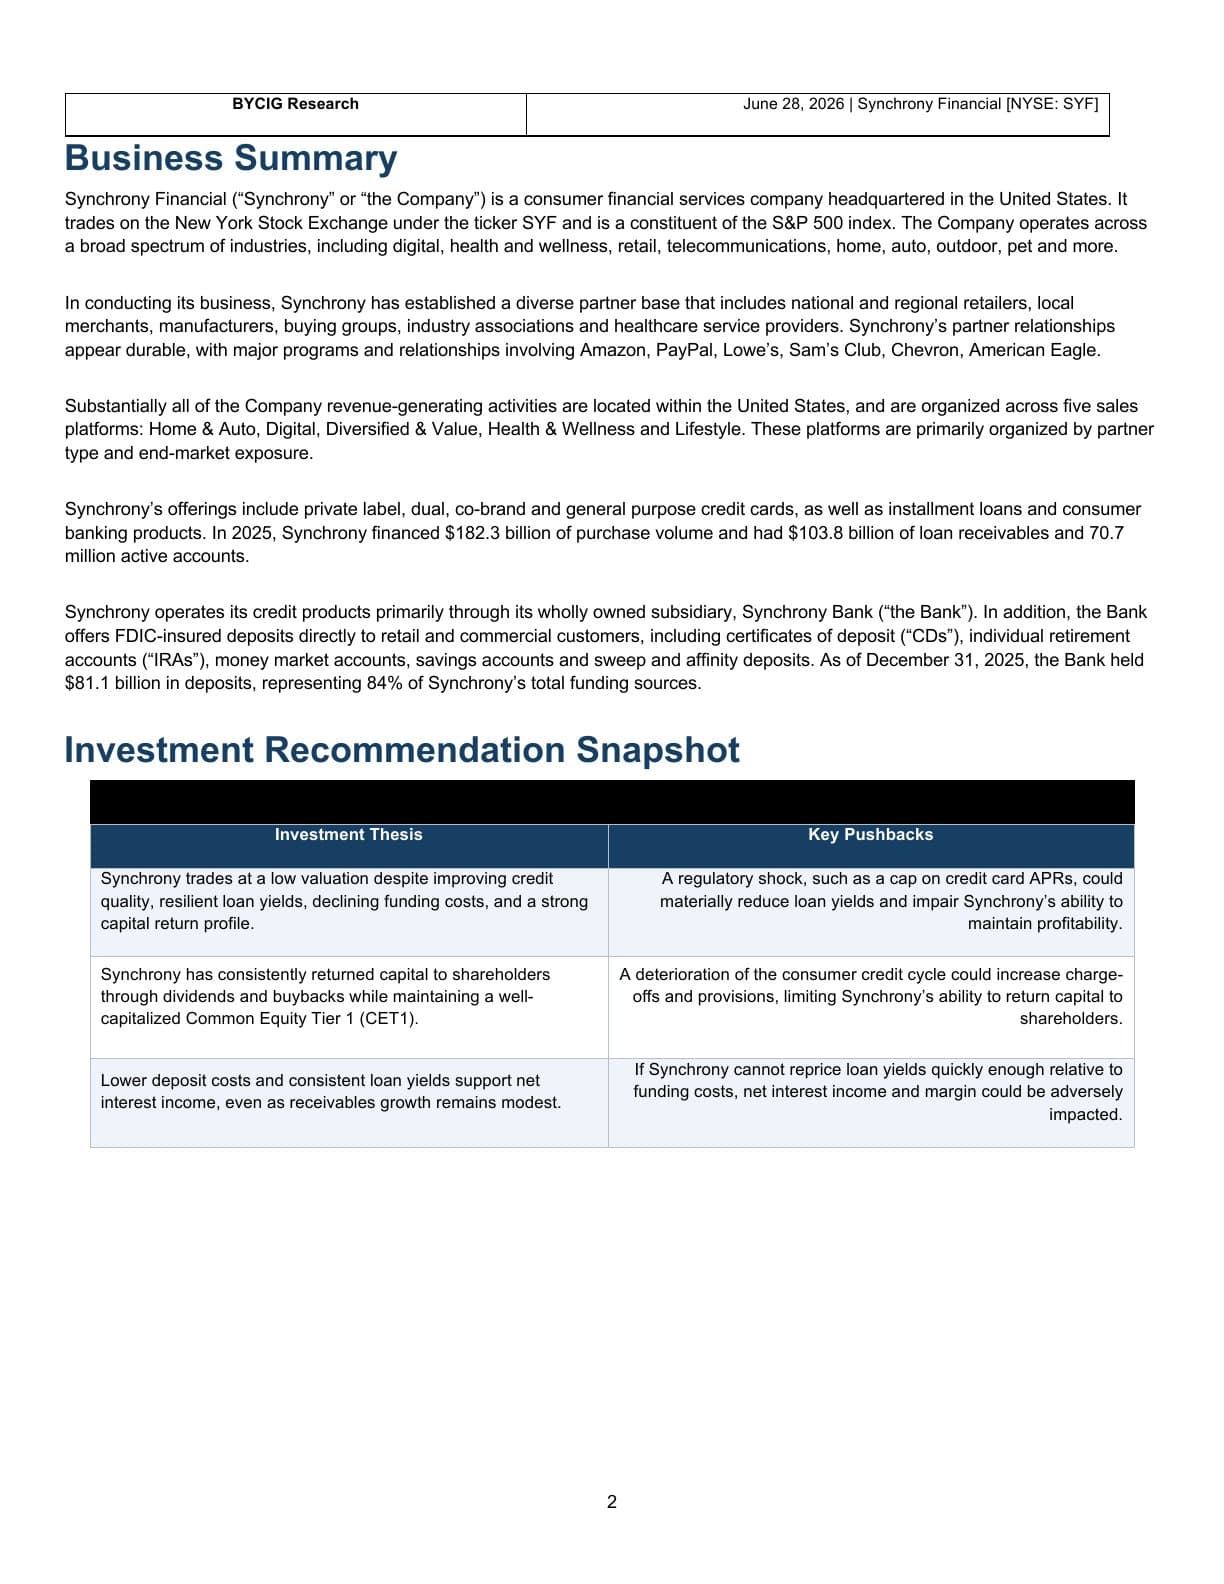
Page 2Business summary and recommendation snapshot 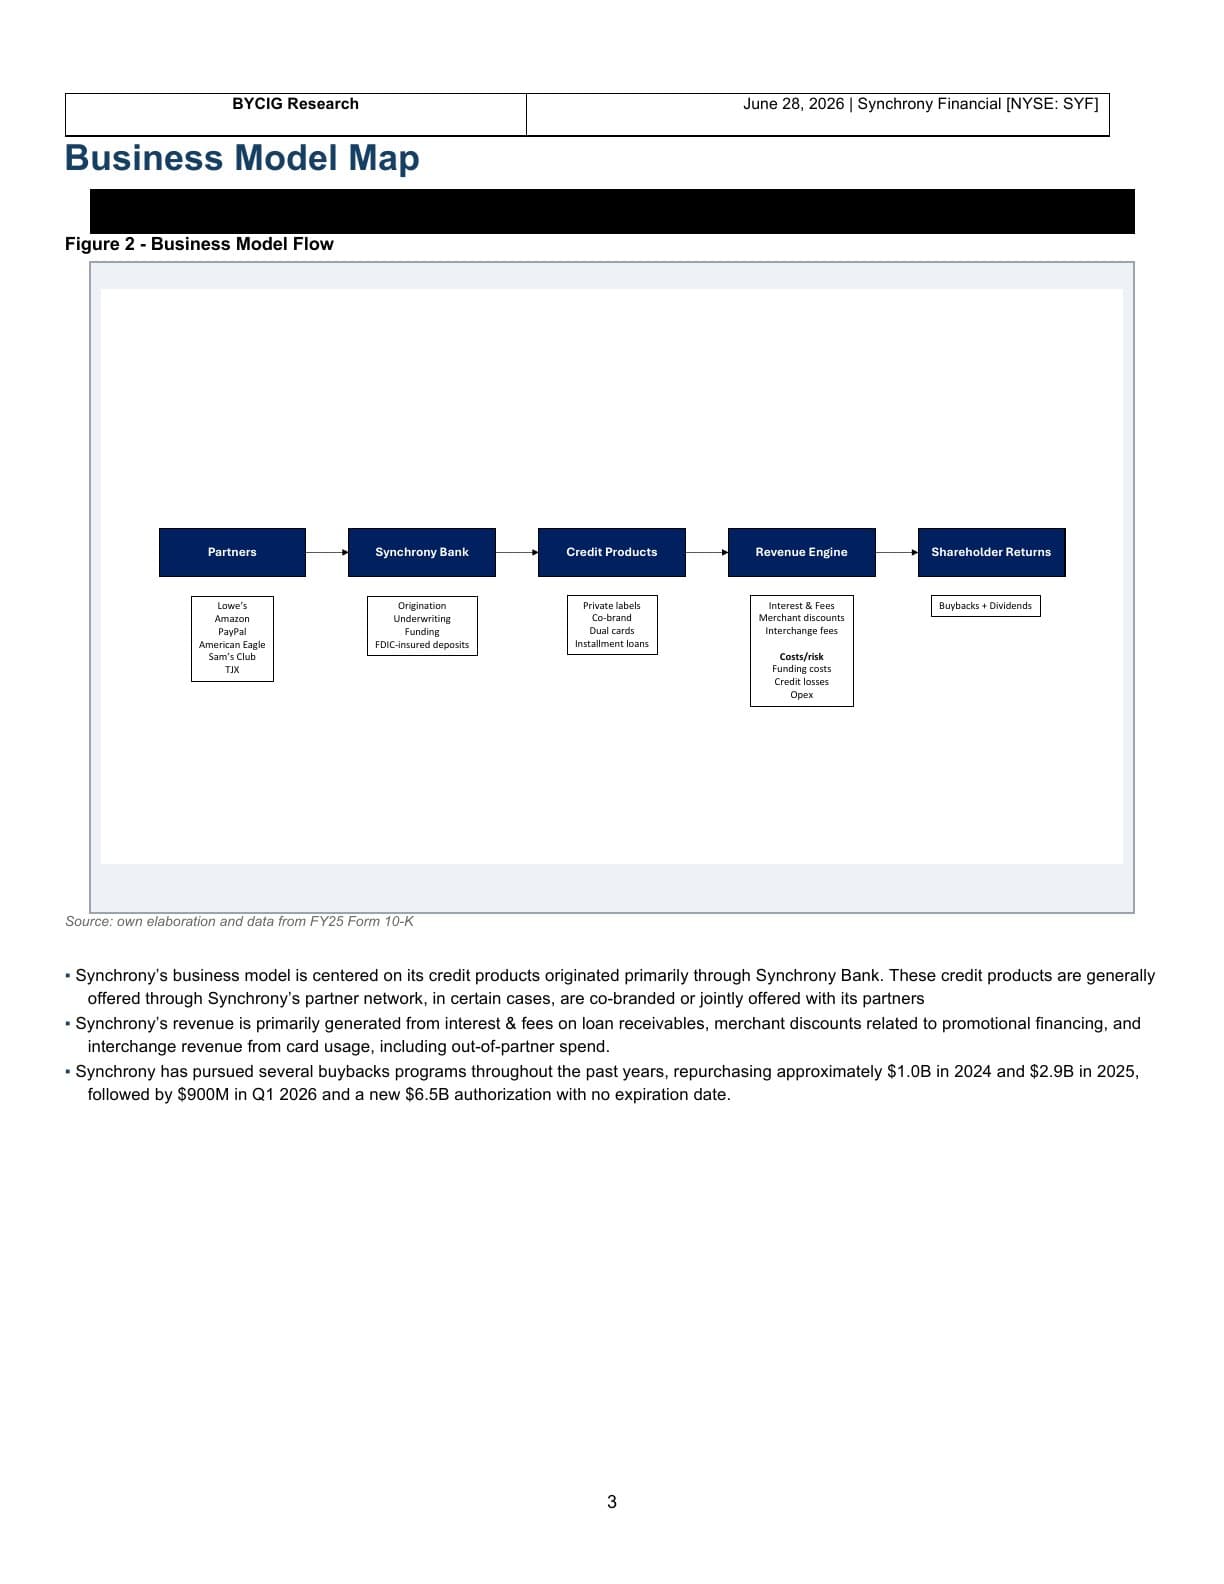
Page 3Business model map 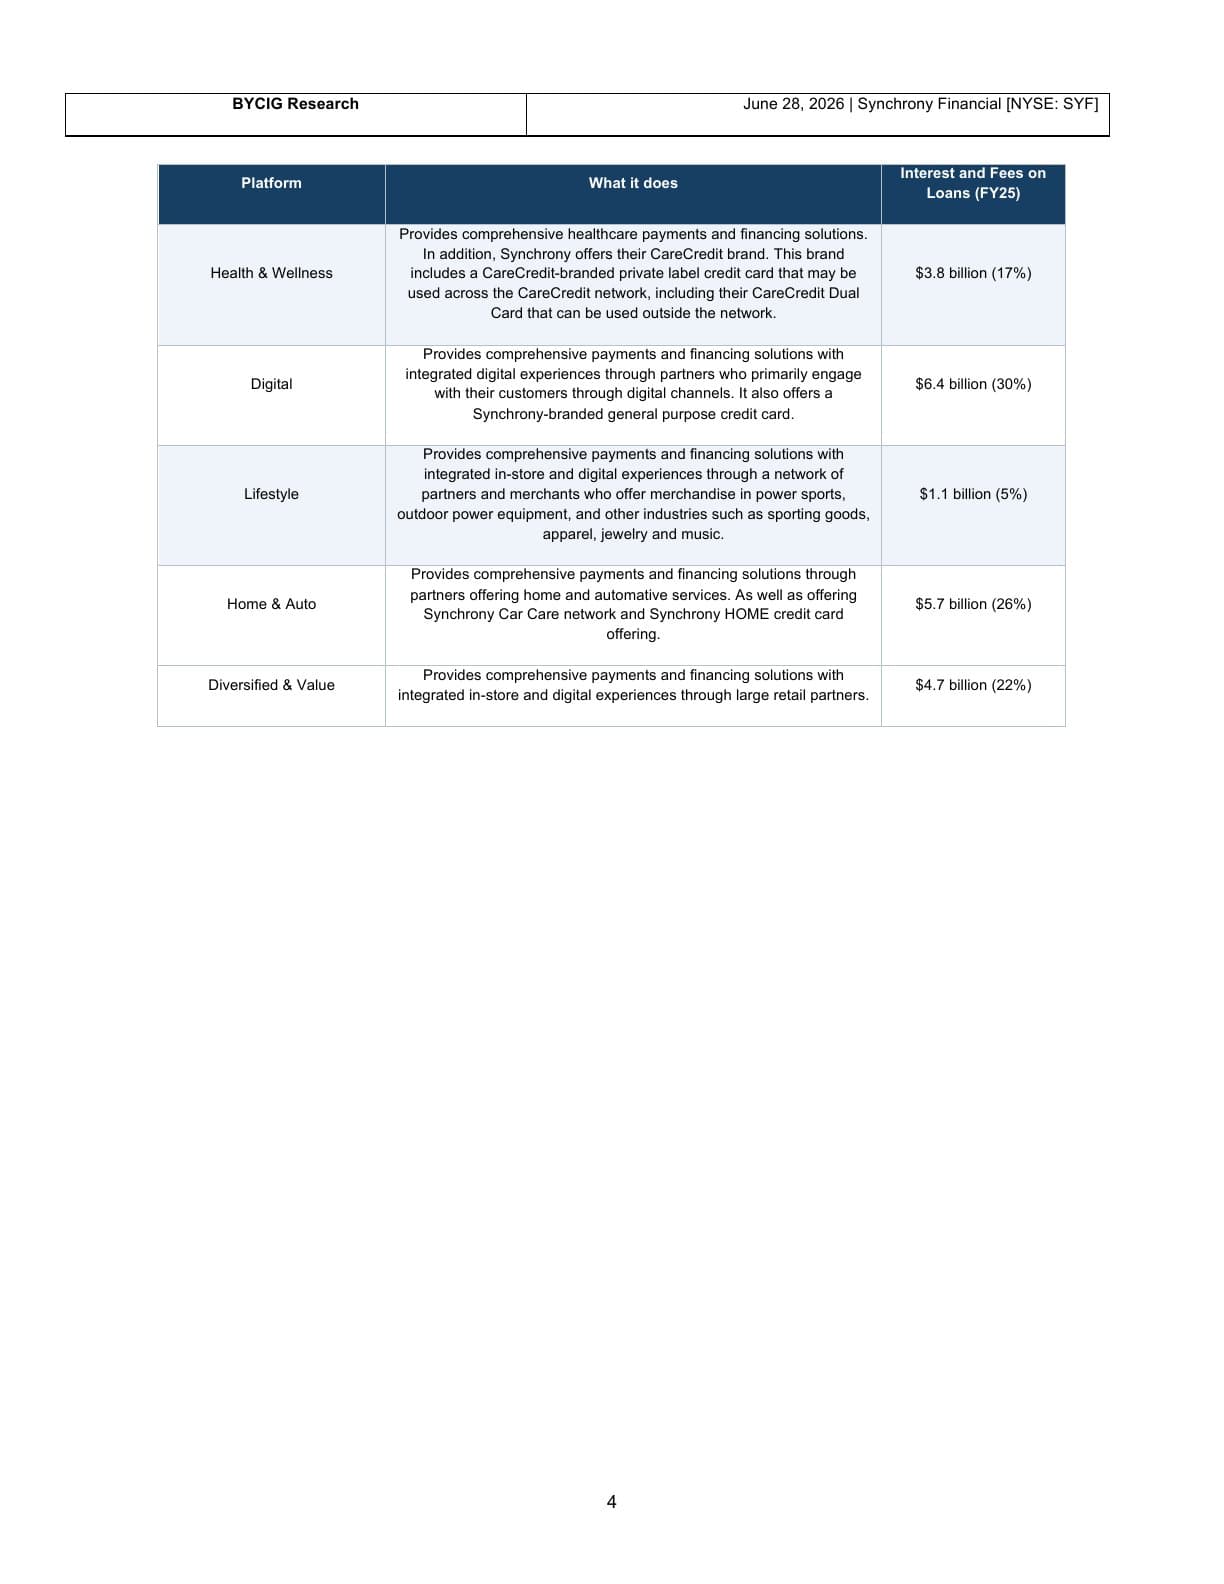
Page 4Sales platforms 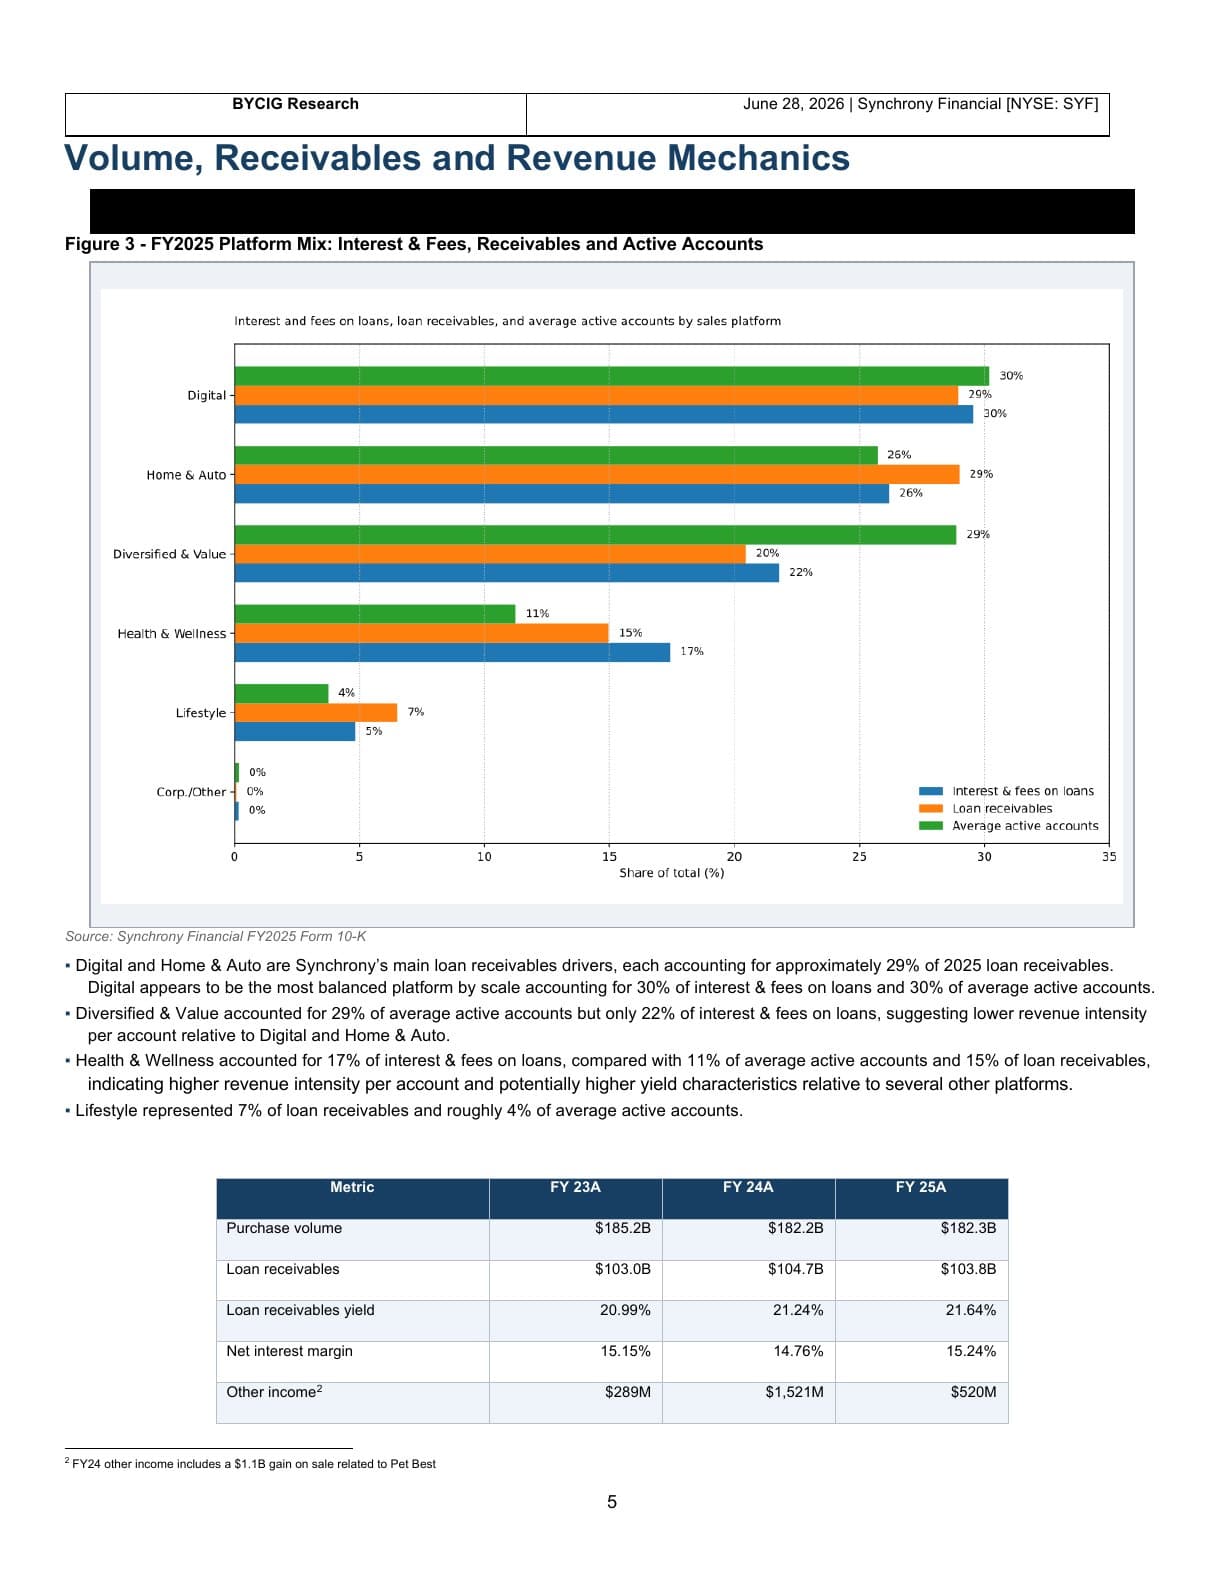
Page 5Volume, receivables, and revenue mechanics 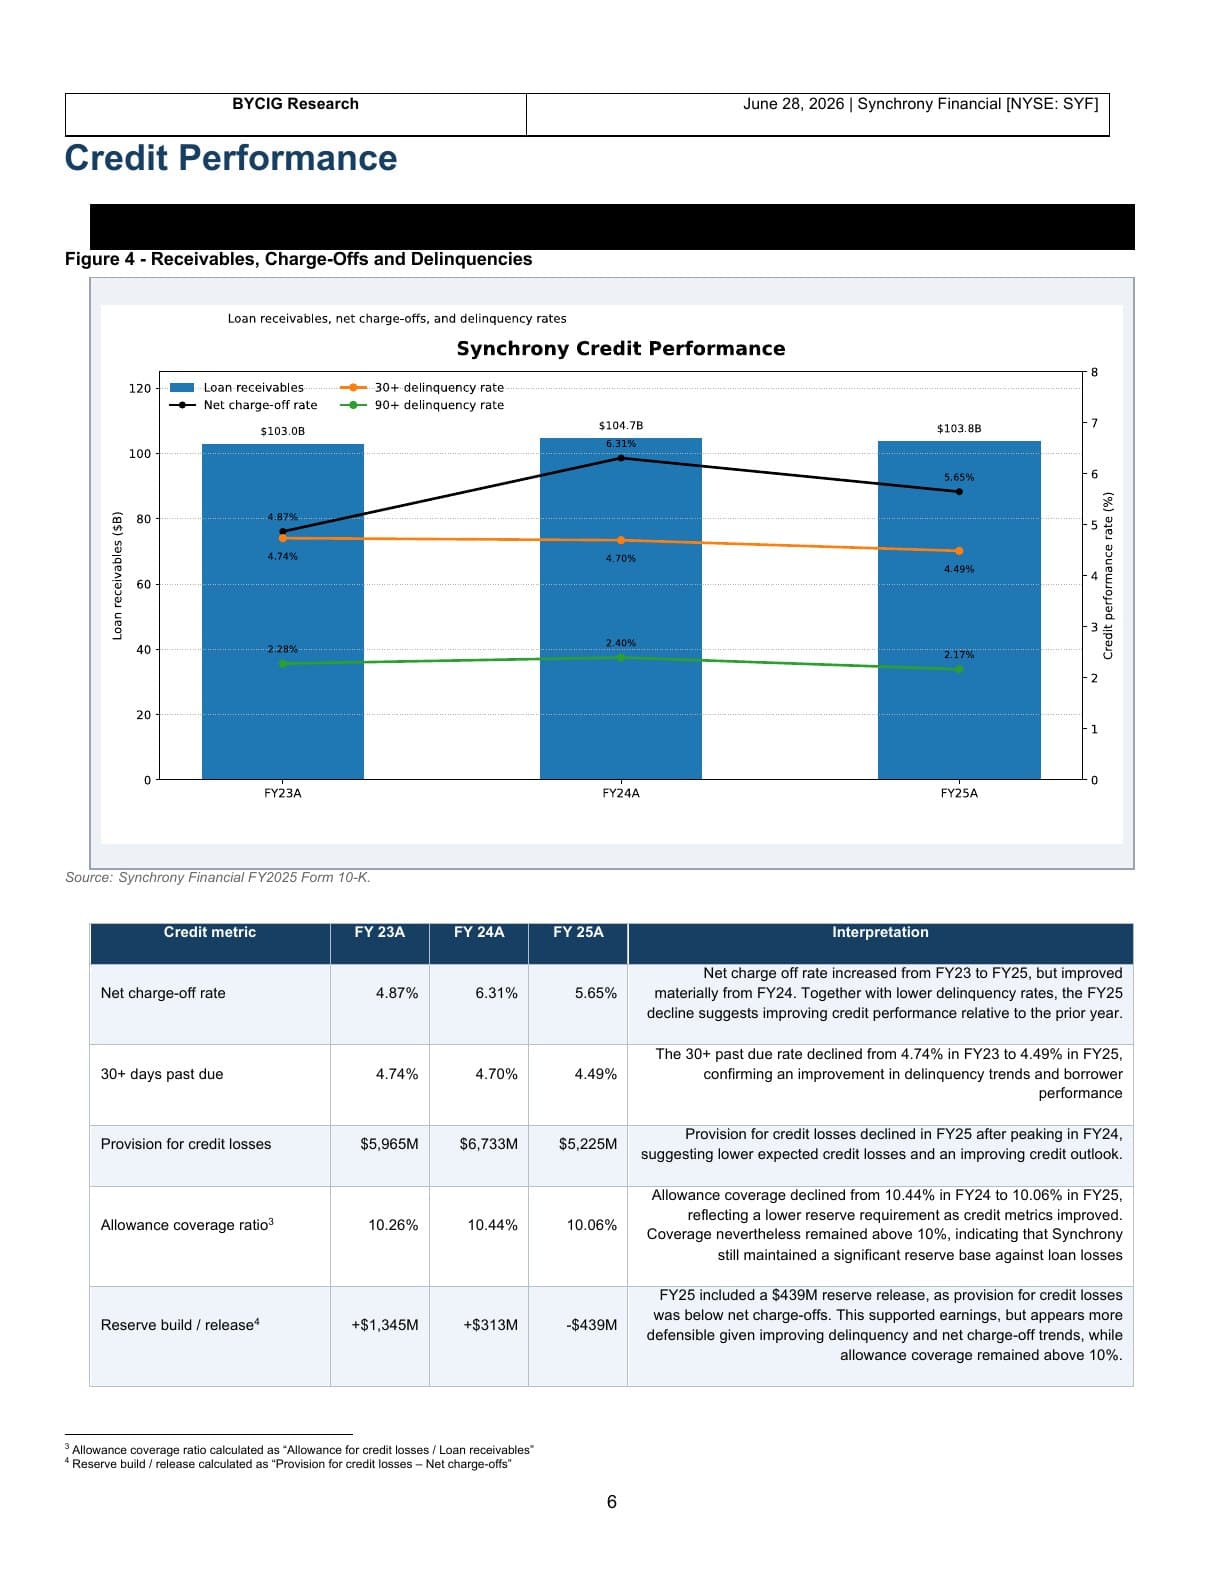
Page 6Credit performance 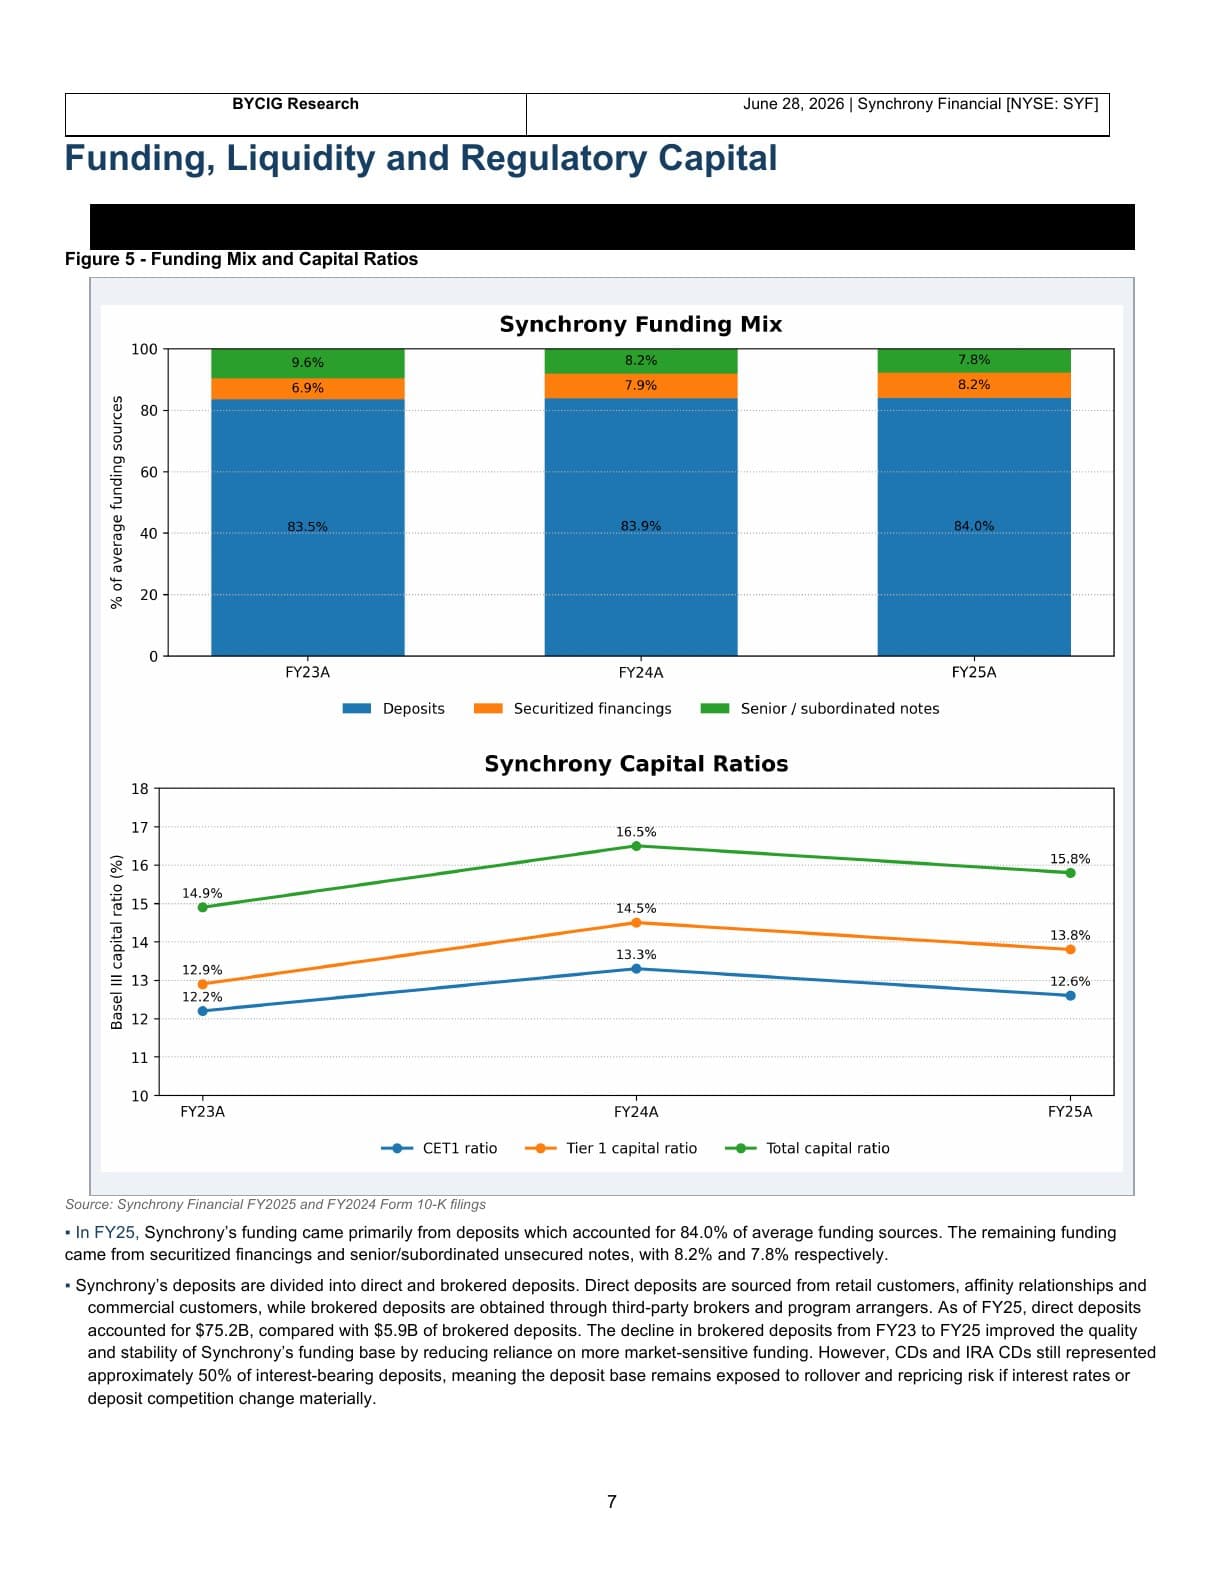
Page 7Funding, liquidity, and regulatory capital 
Page 8Funding and liquidity discussion 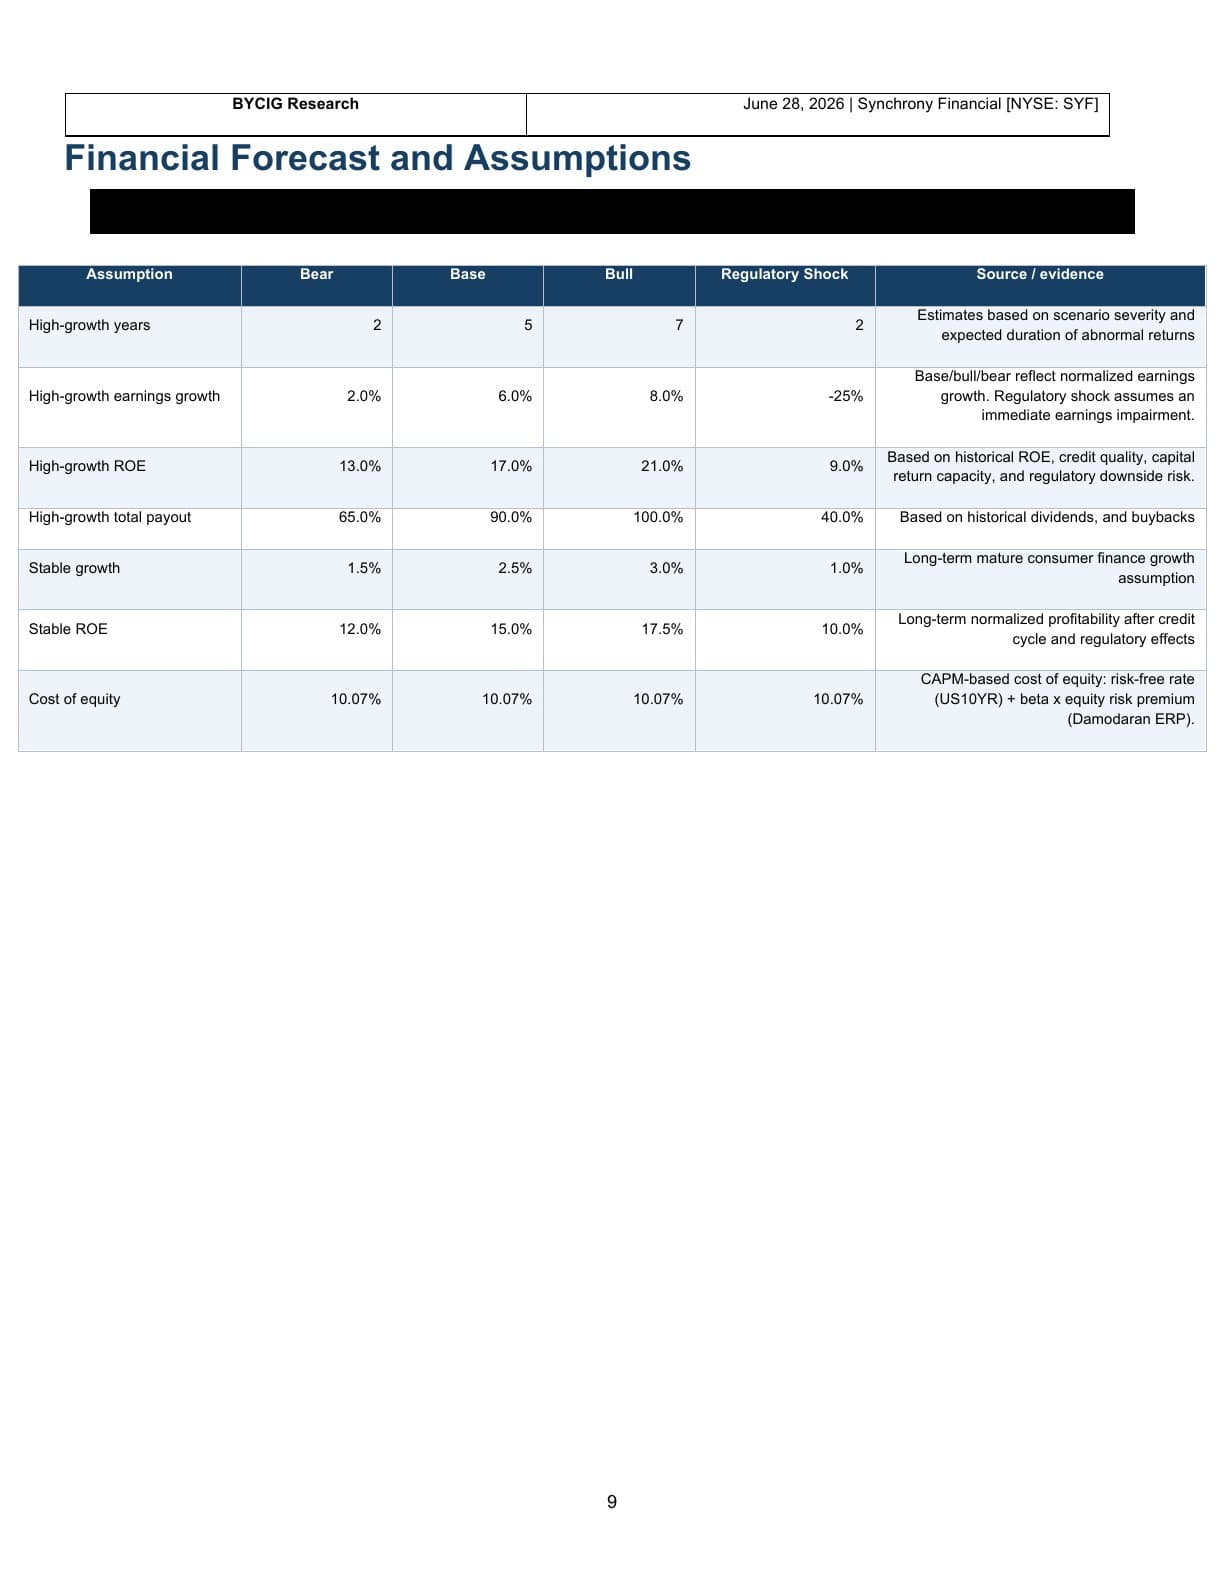
Page 9Financial forecast and assumptions 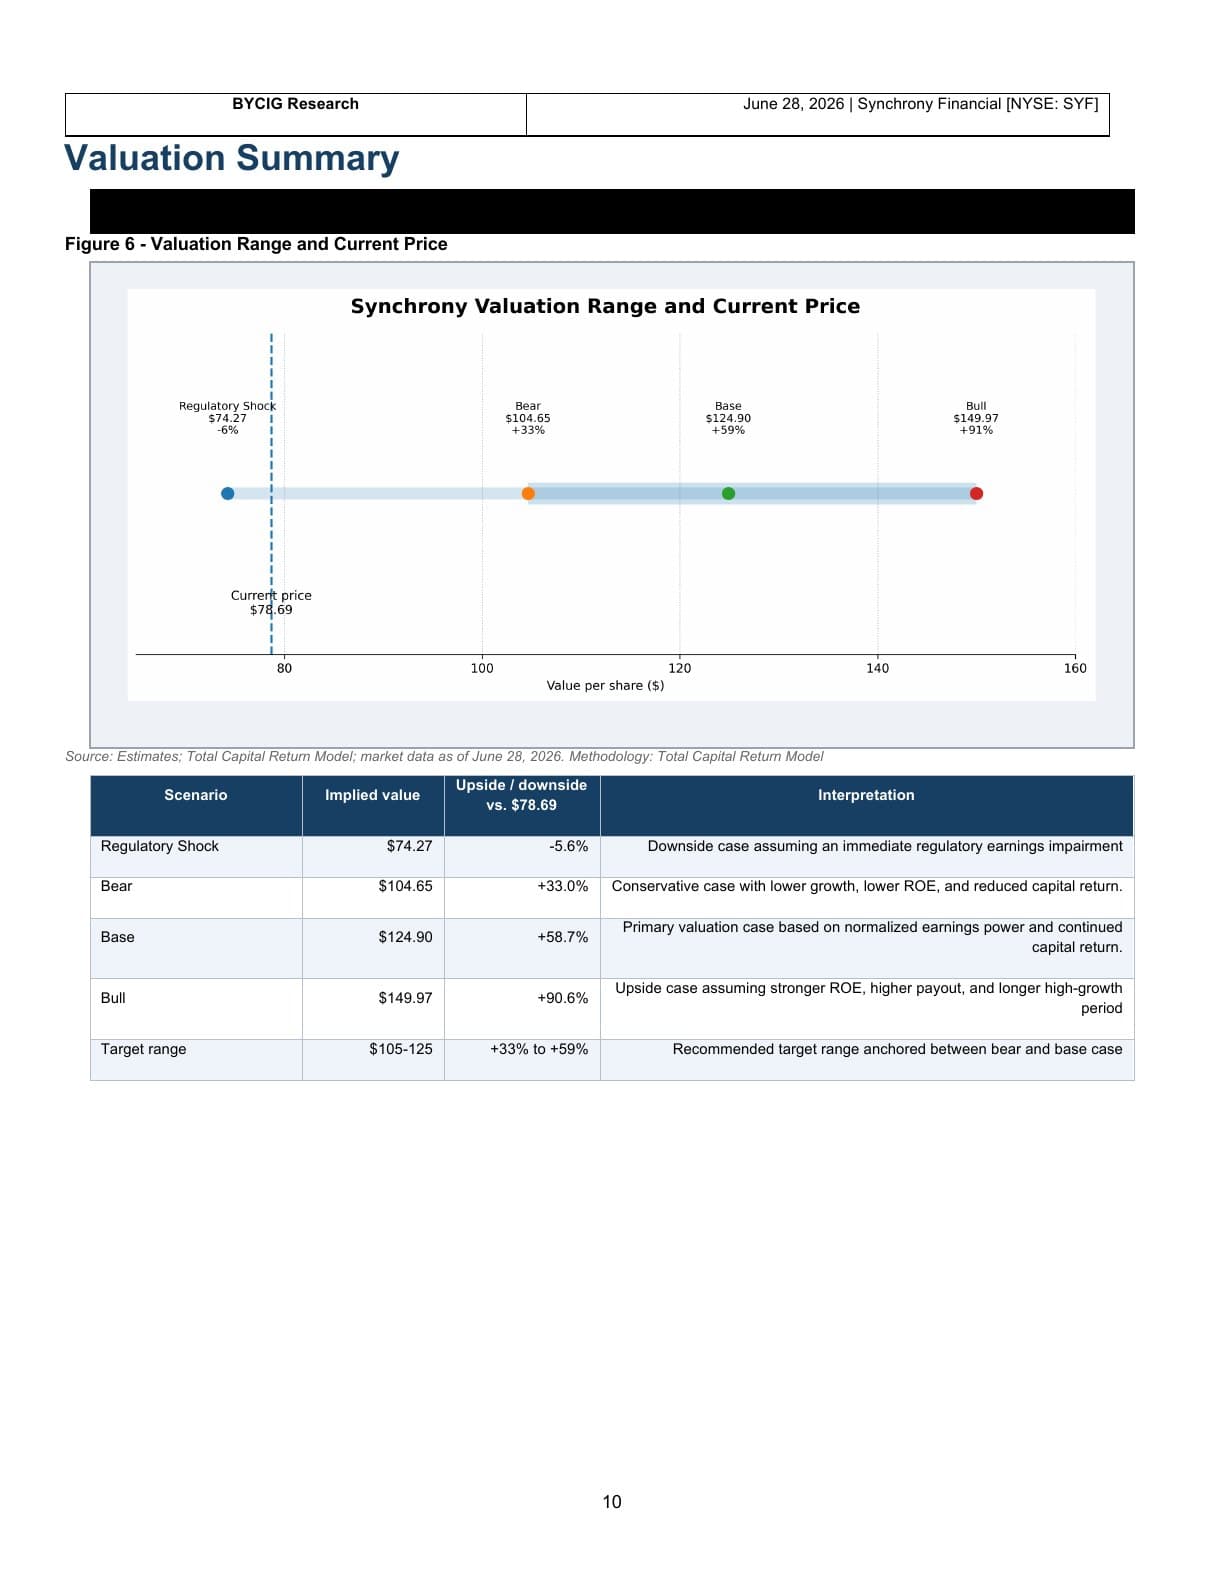
Page 10Valuation summary 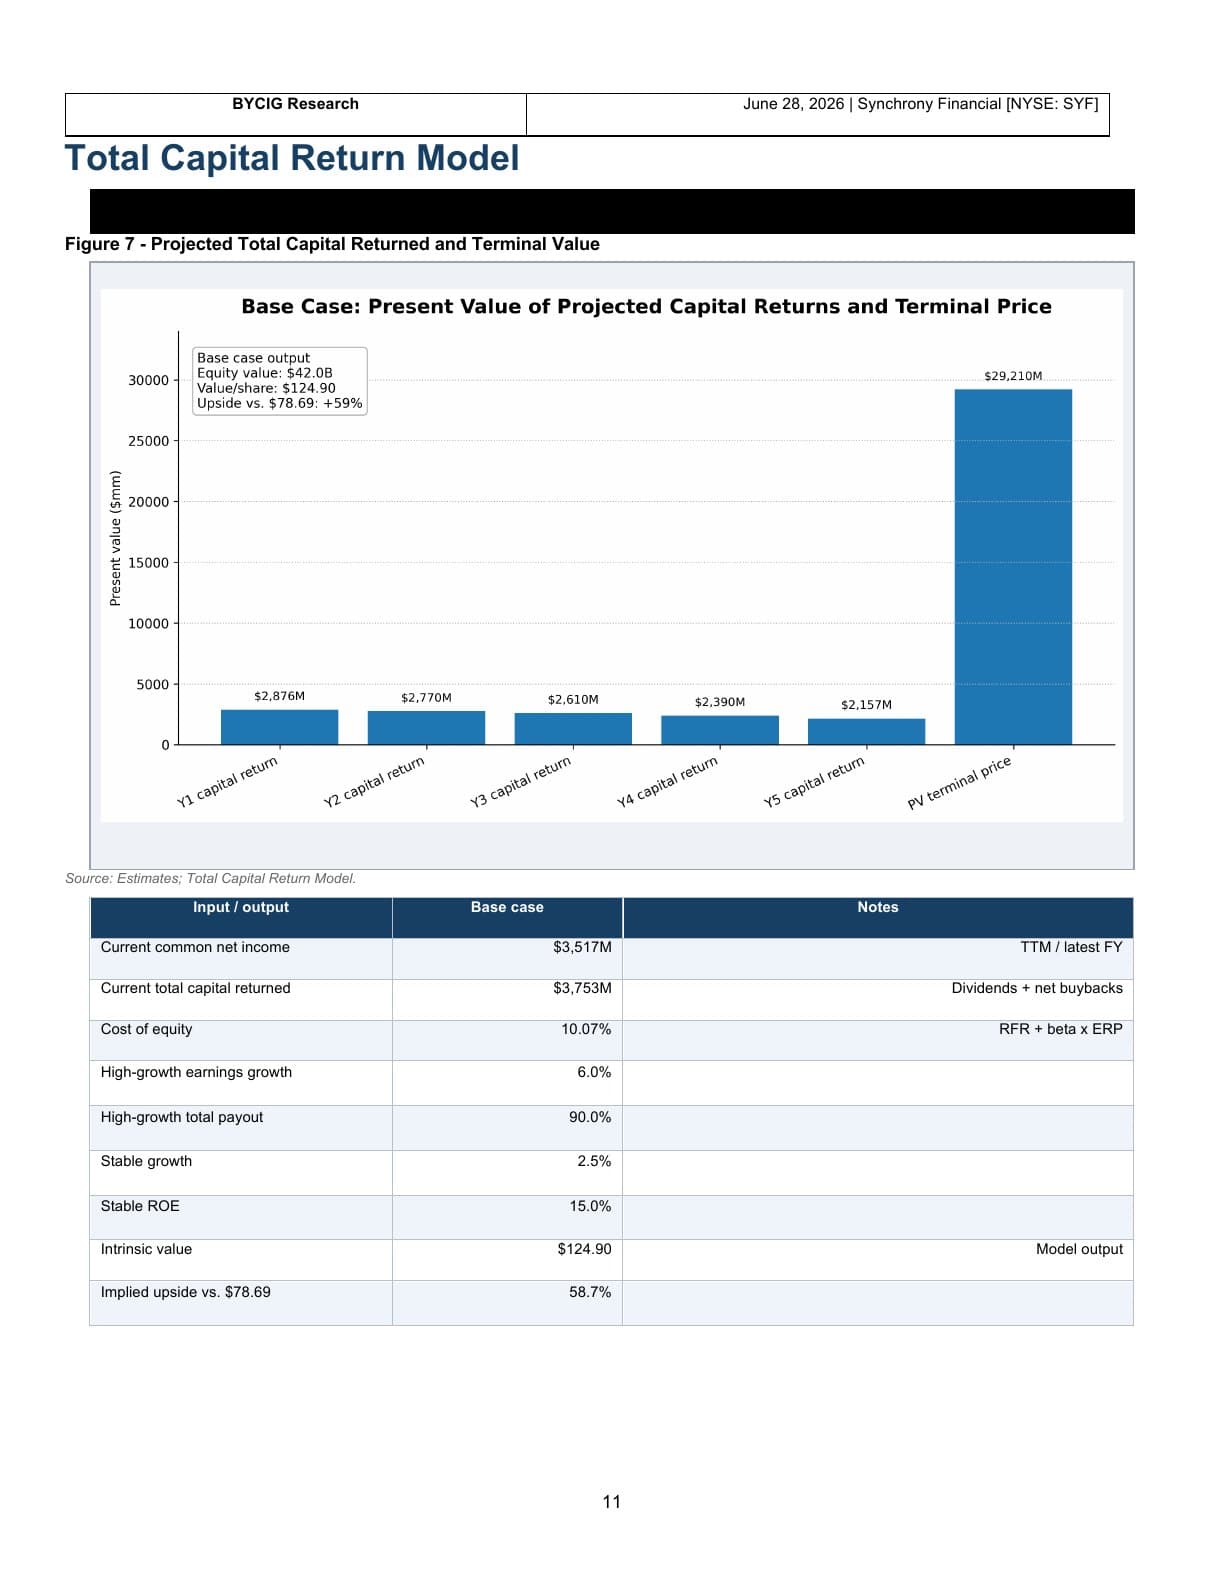
Page 11Total capital return model 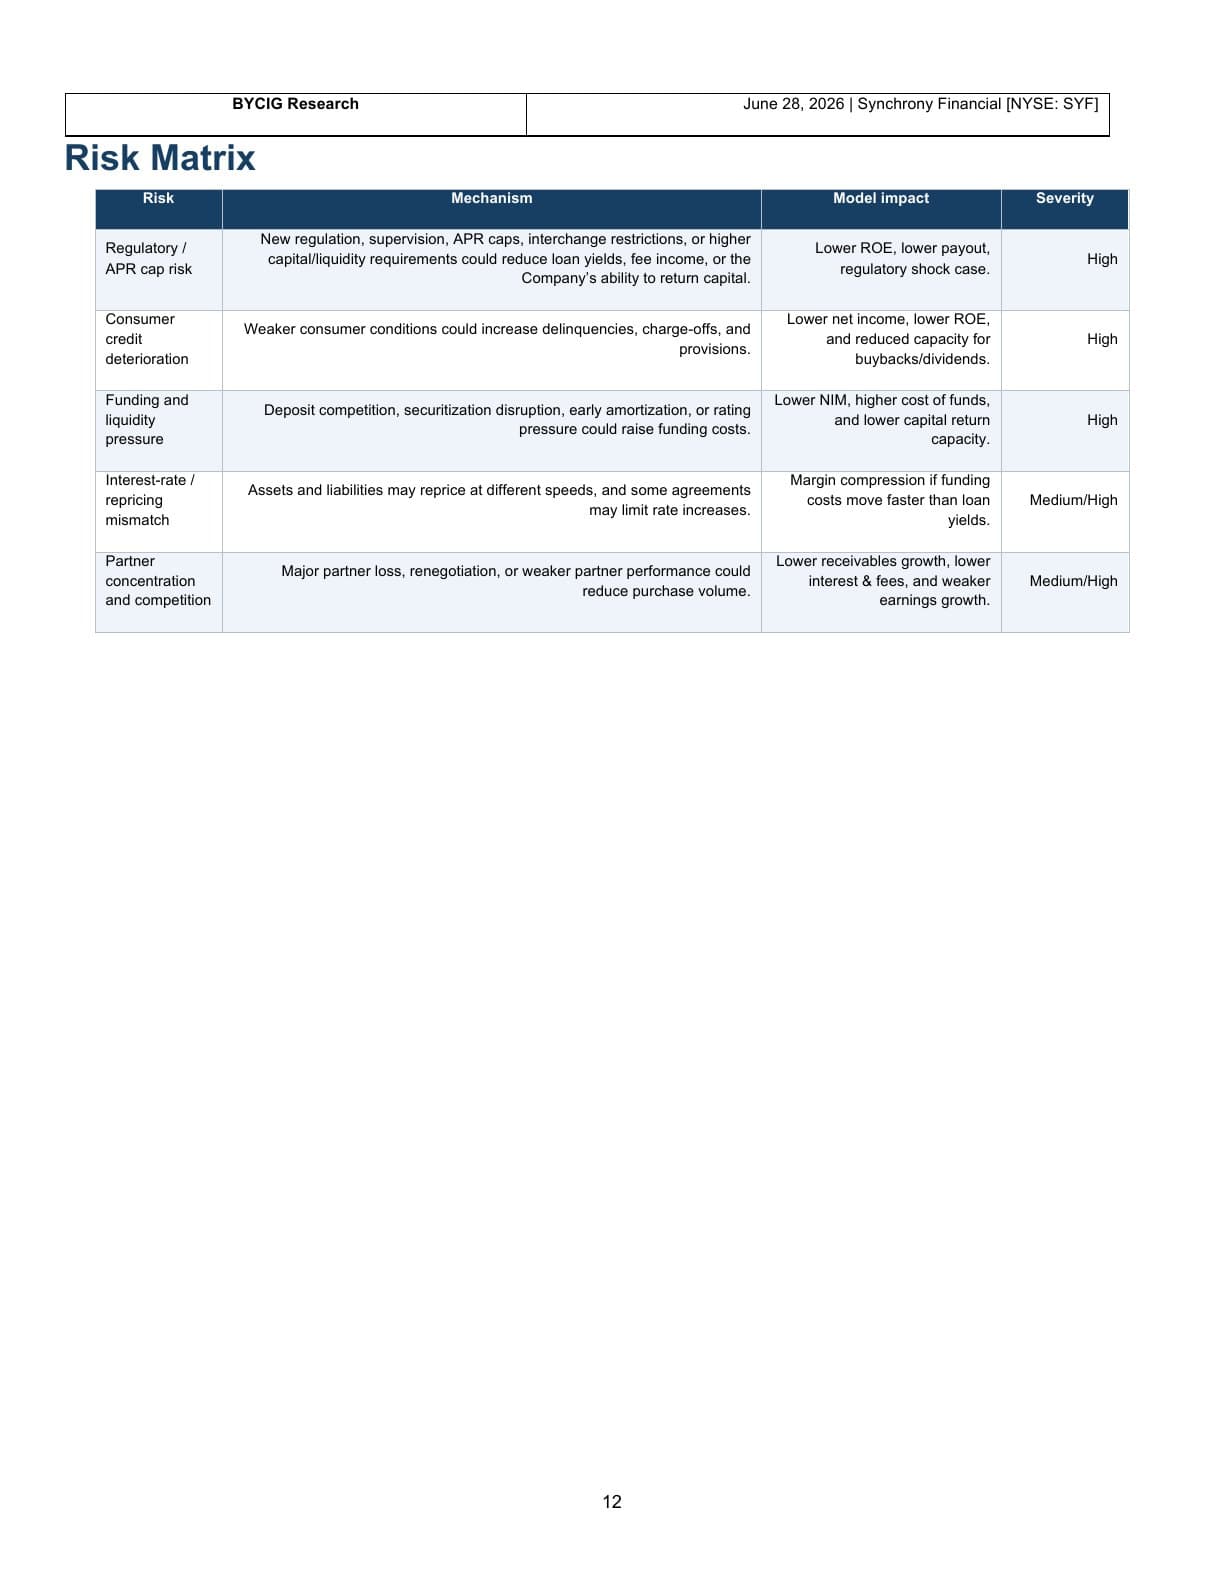
Page 12Risk matrix 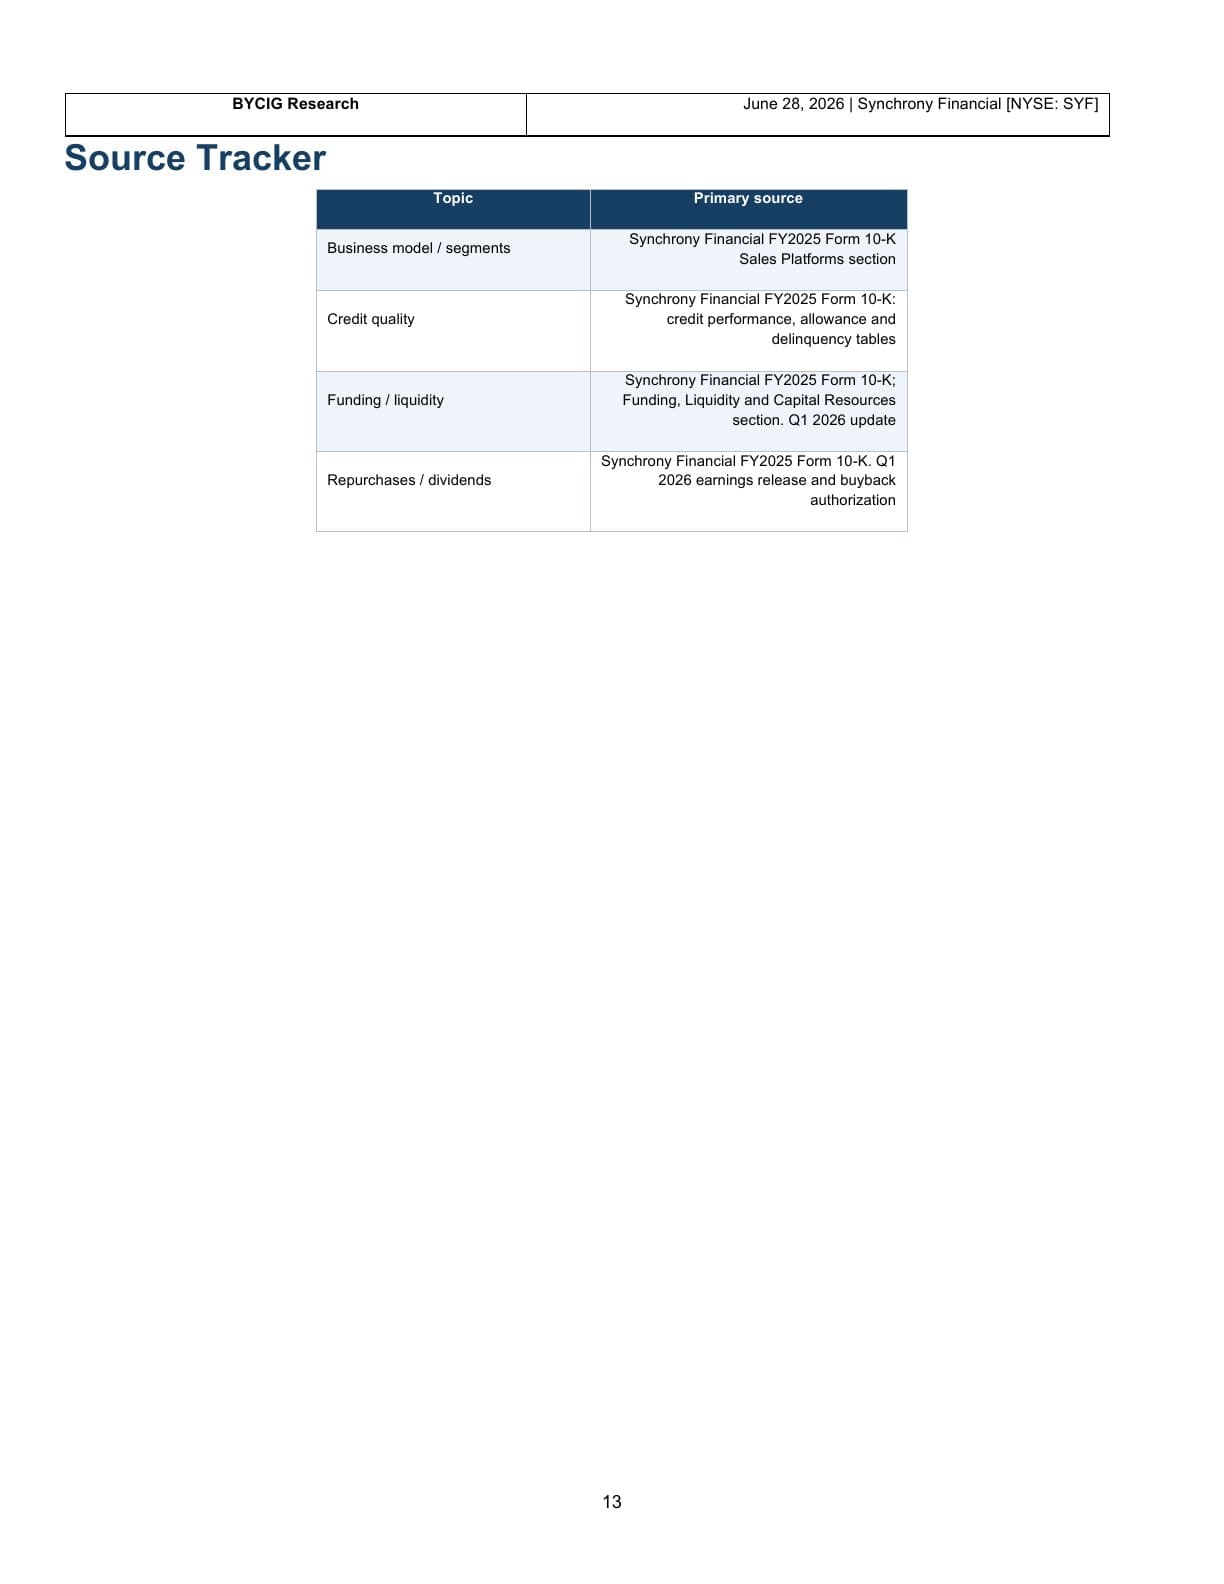
Page 13Source tracker

Accessible text transcript
The transcript preserves the wording and numerical content. Use the report pages above for the original table and chart layout.
SYNCHRONY FINANCIAL [NYSE: SYF]
Equity Research / Financial Services – Consumer Finance & Banking Operations
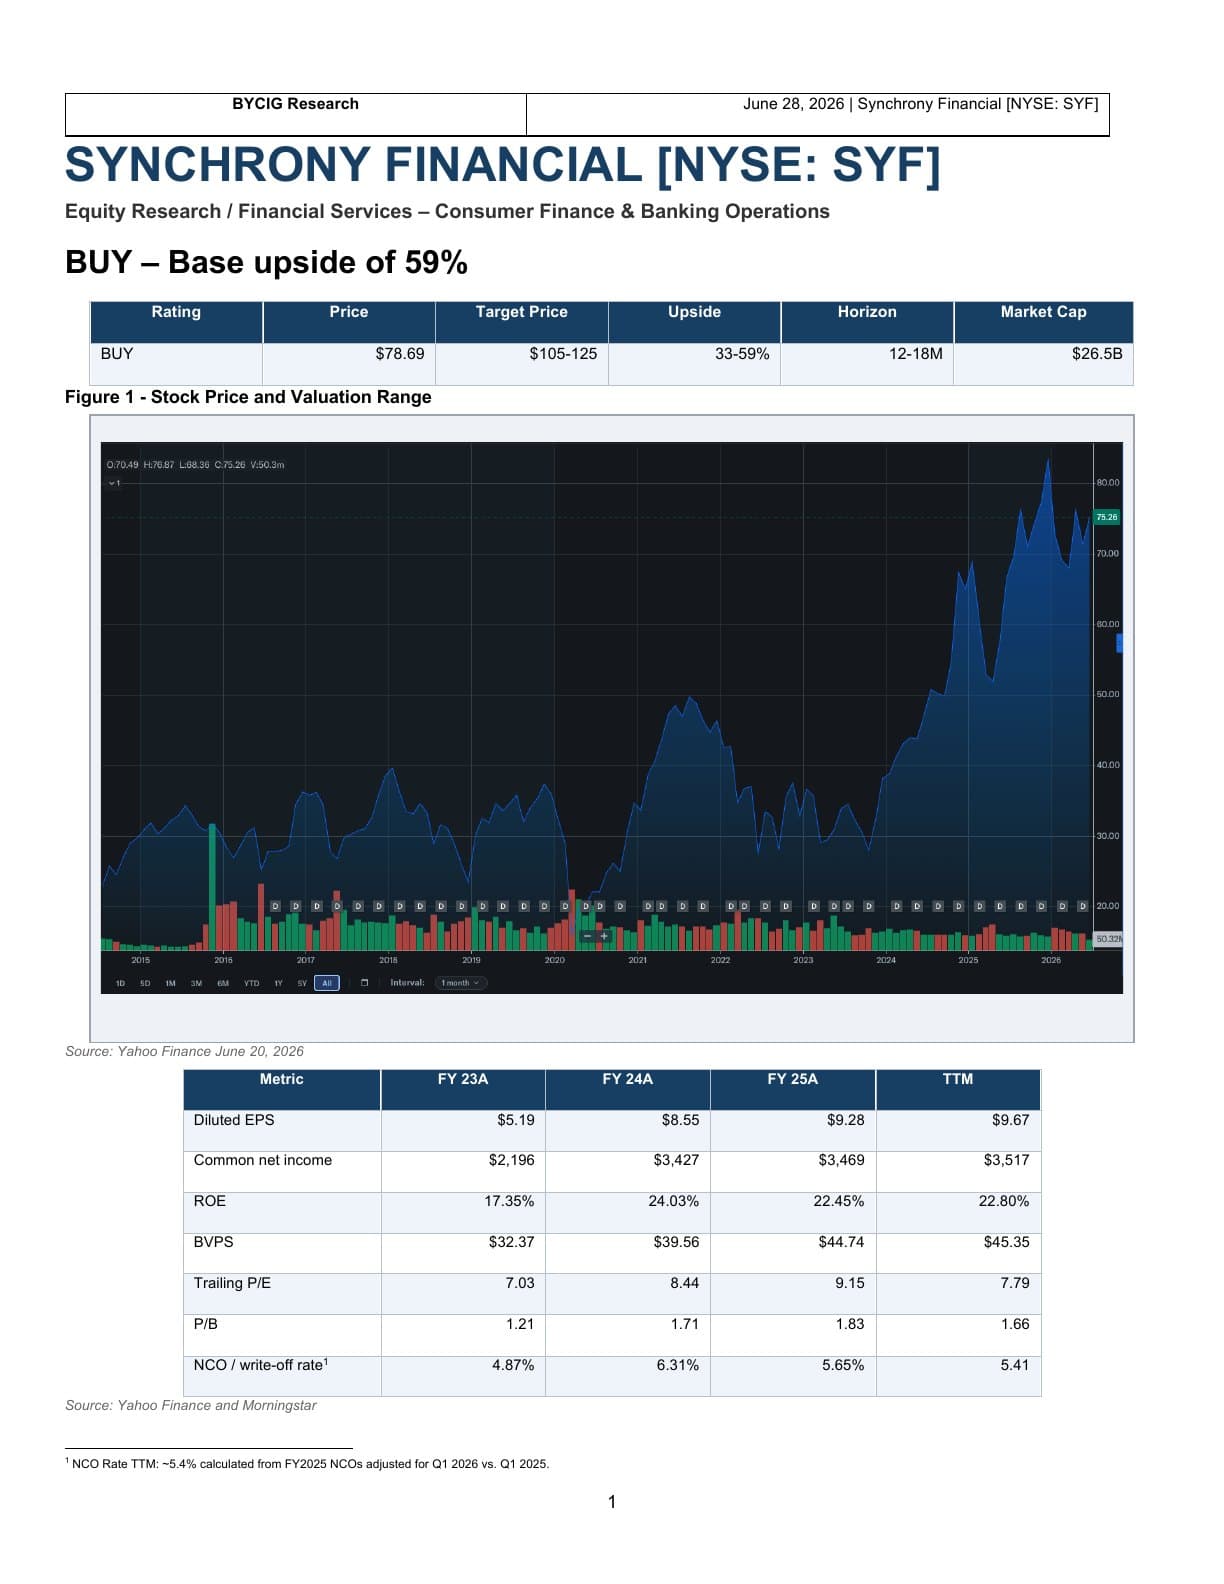
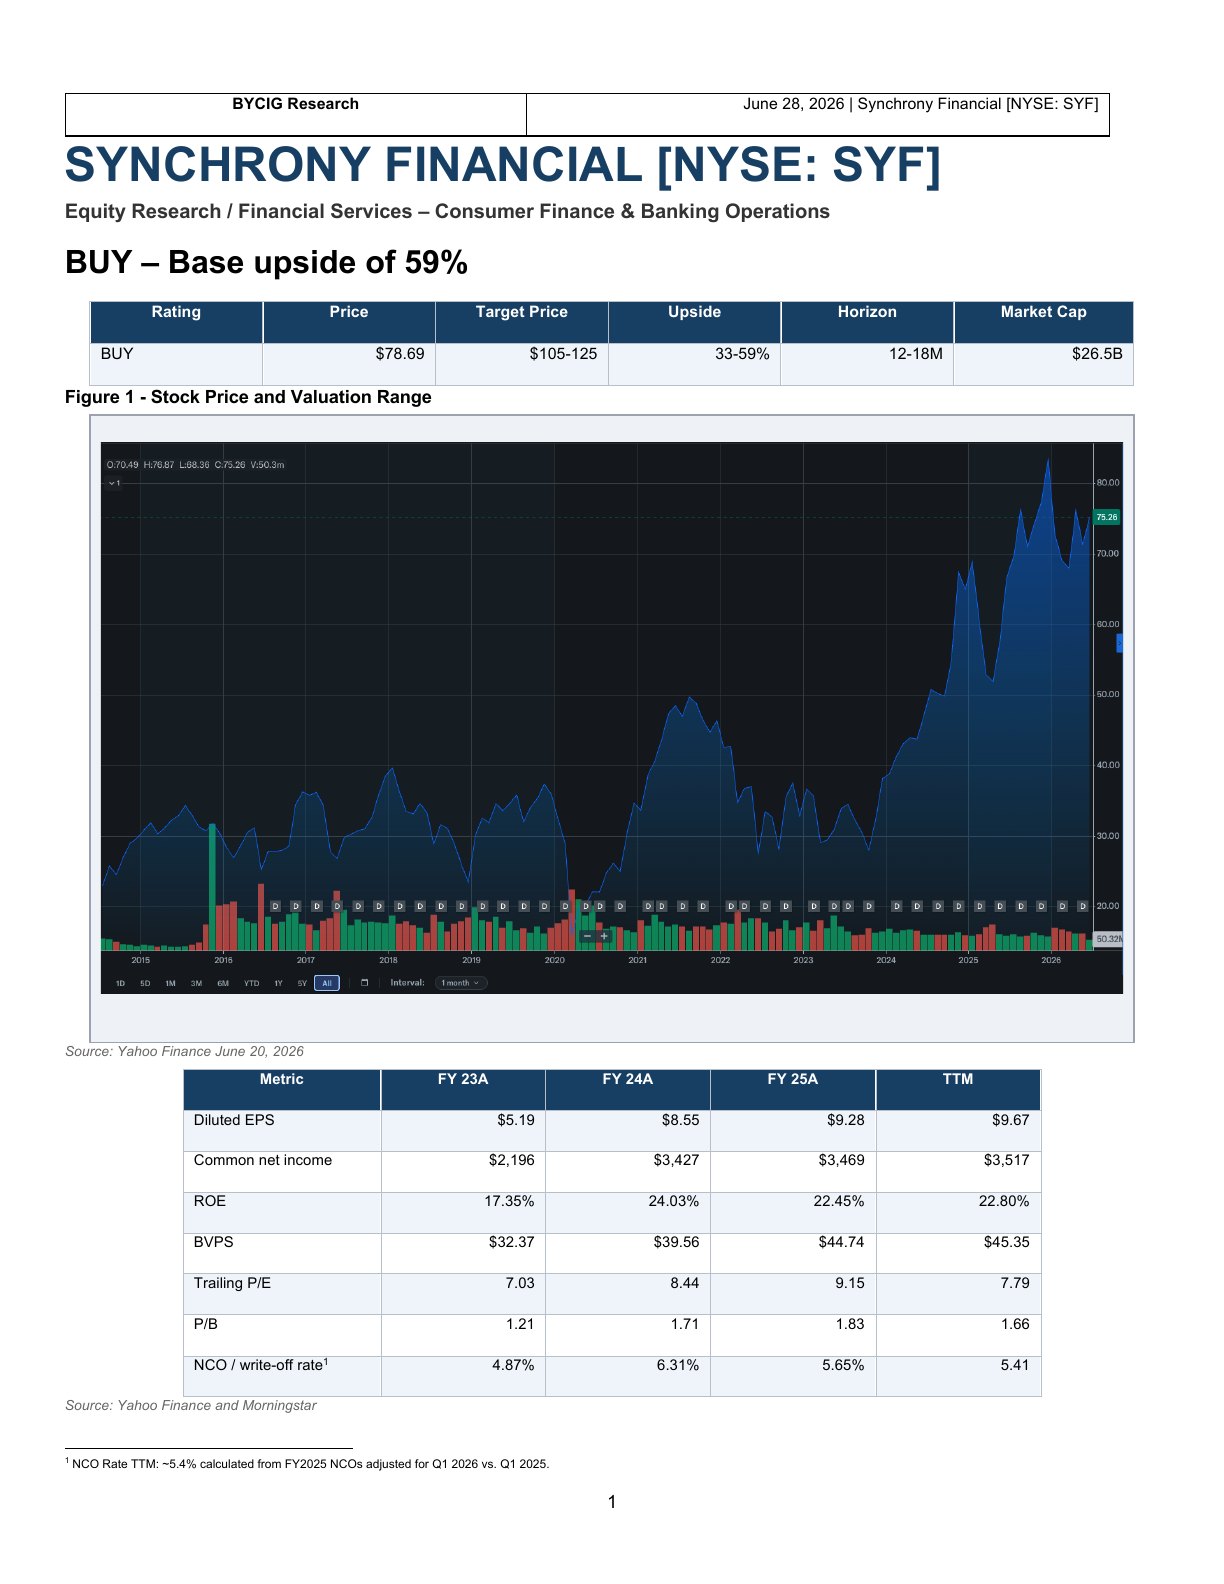
BUY – Base upside of 59%
Rating Price Target Price Upside Horizon Market Cap
BUY $78.69 $105-125 33-59% 12-18M $26.5B
Figure 1 - Stock Price and Valuation Range
Source: Yahoo Finance June 20, 2026
Metric FY 23A FY 24A FY 25A TTM
Diluted EPS $5.19 $8.55 $9.28 $9.67
Common net income $2,196 $3,427 $3,469 $3,517
ROE 17.35% 24.03% 22.45% 22.80%
BVPS $32.37 $39.56 $44.74 $45.35
Trailing P/E 7.03 8.44 9.15 7.79
P/B 1.21 1.71 1.83 1.66
NCO / write-off rate1 4.87% 6.31% 5.65% 5.41
Source: Yahoo Finance and Morningstar
NCO Rate TTM: ~5.4% calculated from FY2025 NCOs adjusted for Q1 2026 vs. Q1 2025.
Business Summary
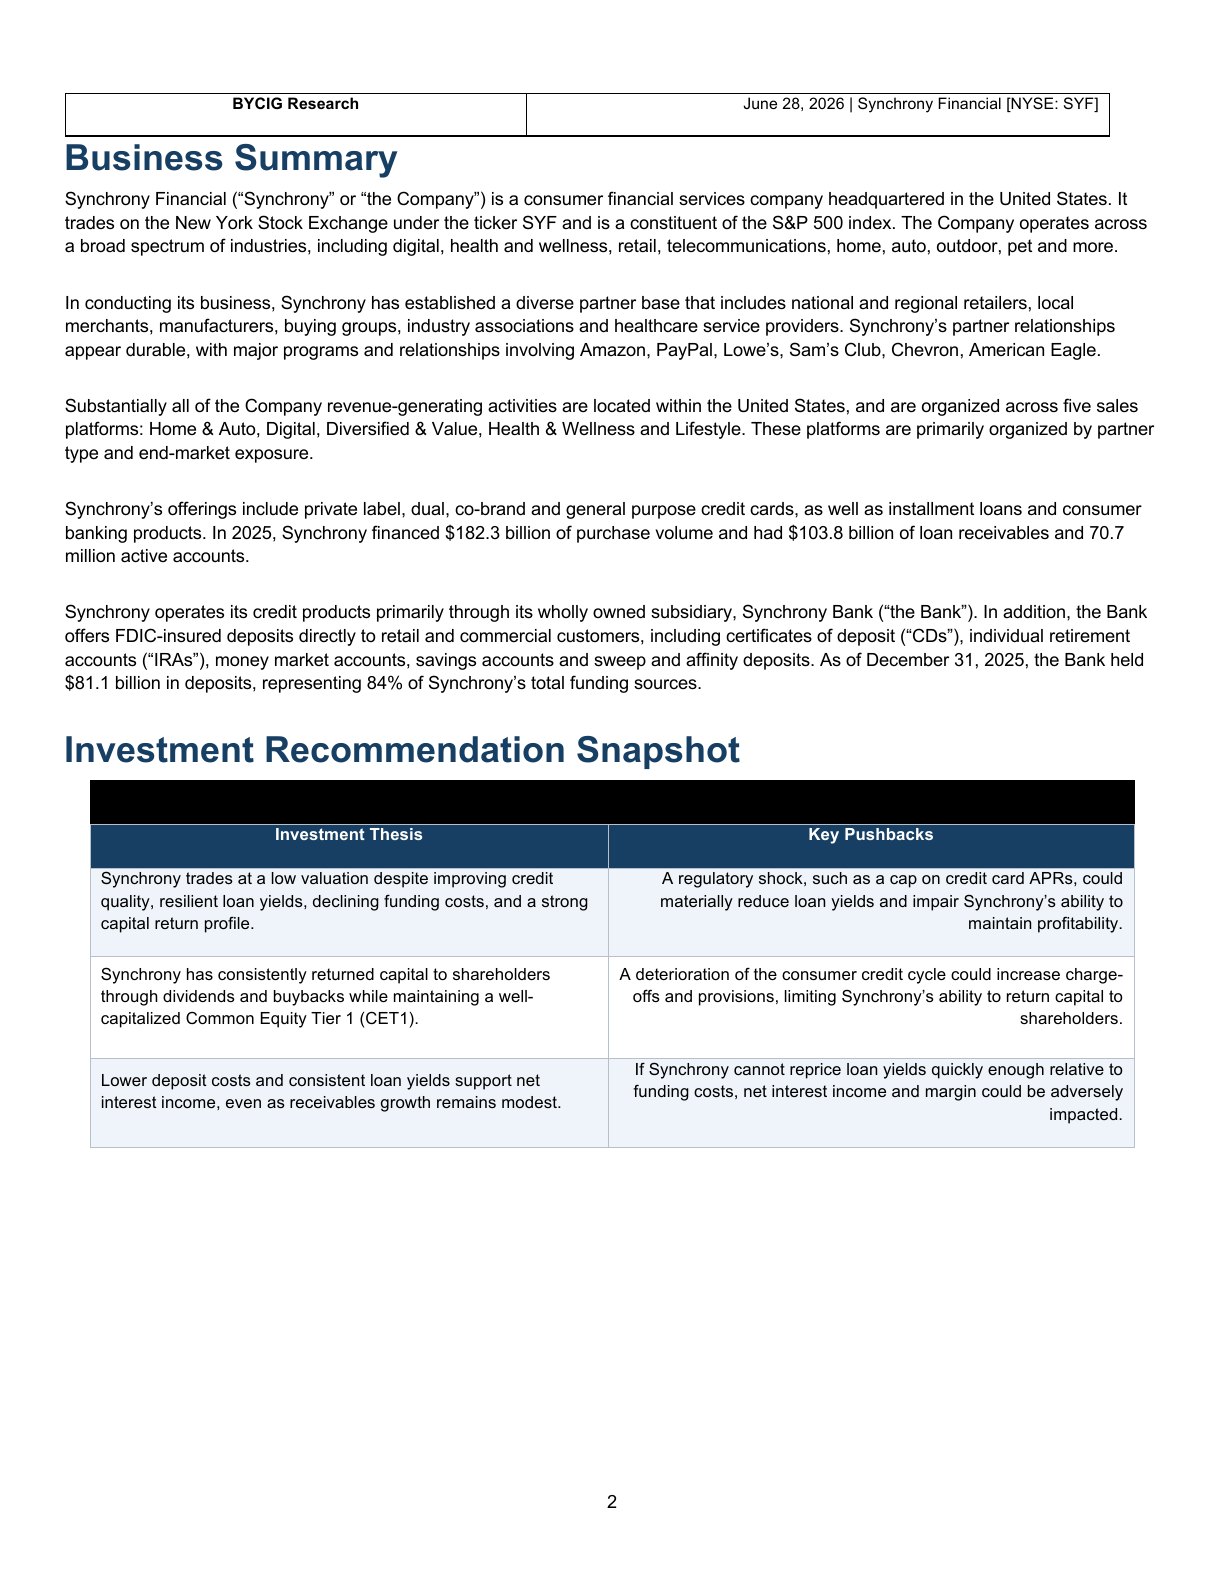
Synchrony Financial (“Synchrony” or “the Company”) is a consumer financial services company headquartered in the United States. It
trades on the New York Stock Exchange under the ticker SYF and is a constituent of the S&P 500 index. The Company operates across
a broad spectrum of industries, including digital, health and wellness, retail, telecommunications, home, auto, outdoor, pet and more.
In conducting its business, Synchrony has established a diverse partner base that includes national and regional retailers, local
merchants, manufacturers, buying groups, industry associations and healthcare service providers. Synchrony’s partner relationships
appear durable, with major programs and relationships involving Amazon, PayPal, Lowe’s, Sam’s Club, Chevron, American Eagle.
Substantially all of the Company revenue-generating activities are located within the United States, and are organized across five sales
platforms: Home & Auto, Digital, Diversified & Value, Health & Wellness and Lifestyle. These platforms are primarily organized by partner
type and end-market exposure.
Synchrony’s offerings include private label, dual, co-brand and general purpose credit cards, as well as installment loans and consumer
banking products. In 2025, Synchrony financed $182.3 billion of purchase volume and had $103.8 billion of loan receivables and 70.7
million active accounts.
Synchrony operates its credit products primarily through its wholly owned subsidiary, Synchrony Bank (“the Bank”). In addition, the Bank
offers FDIC-insured deposits directly to retail and commercial customers, including certificates of deposit (“CDs”), individual retirement
accounts (“IRAs”), money market accounts, savings accounts and sweep and affinity deposits. As of December 31, 2025, the Bank held
$81.1 billion in deposits, representing 84% of Synchrony’s total funding sources.
Investment Recommendation Snapshot
Investment Thesis Key Pushbacks
Synchrony trades at a low valuation despite improving credit A regulatory shock, such as a cap on credit card APRs, could
quality, resilient loan yields, declining funding costs, and a strong materially reduce loan yields and impair Synchrony’s ability to
capital return profile. maintain profitability.
Synchrony has consistently returned capital to shareholders A deterioration of the consumer credit cycle could increase charge-
through dividends and buybacks while maintaining a well- offs and provisions, limiting Synchrony’s ability to return capital to
capitalized Common Equity Tier 1 (CET1). shareholders.
If Synchrony cannot reprice loan yields quickly enough relative to
Lower deposit costs and consistent loan yields support net
funding costs, net interest income and margin could be adversely
interest income, even as receivables growth remains modest.
impacted.
Business Model Map
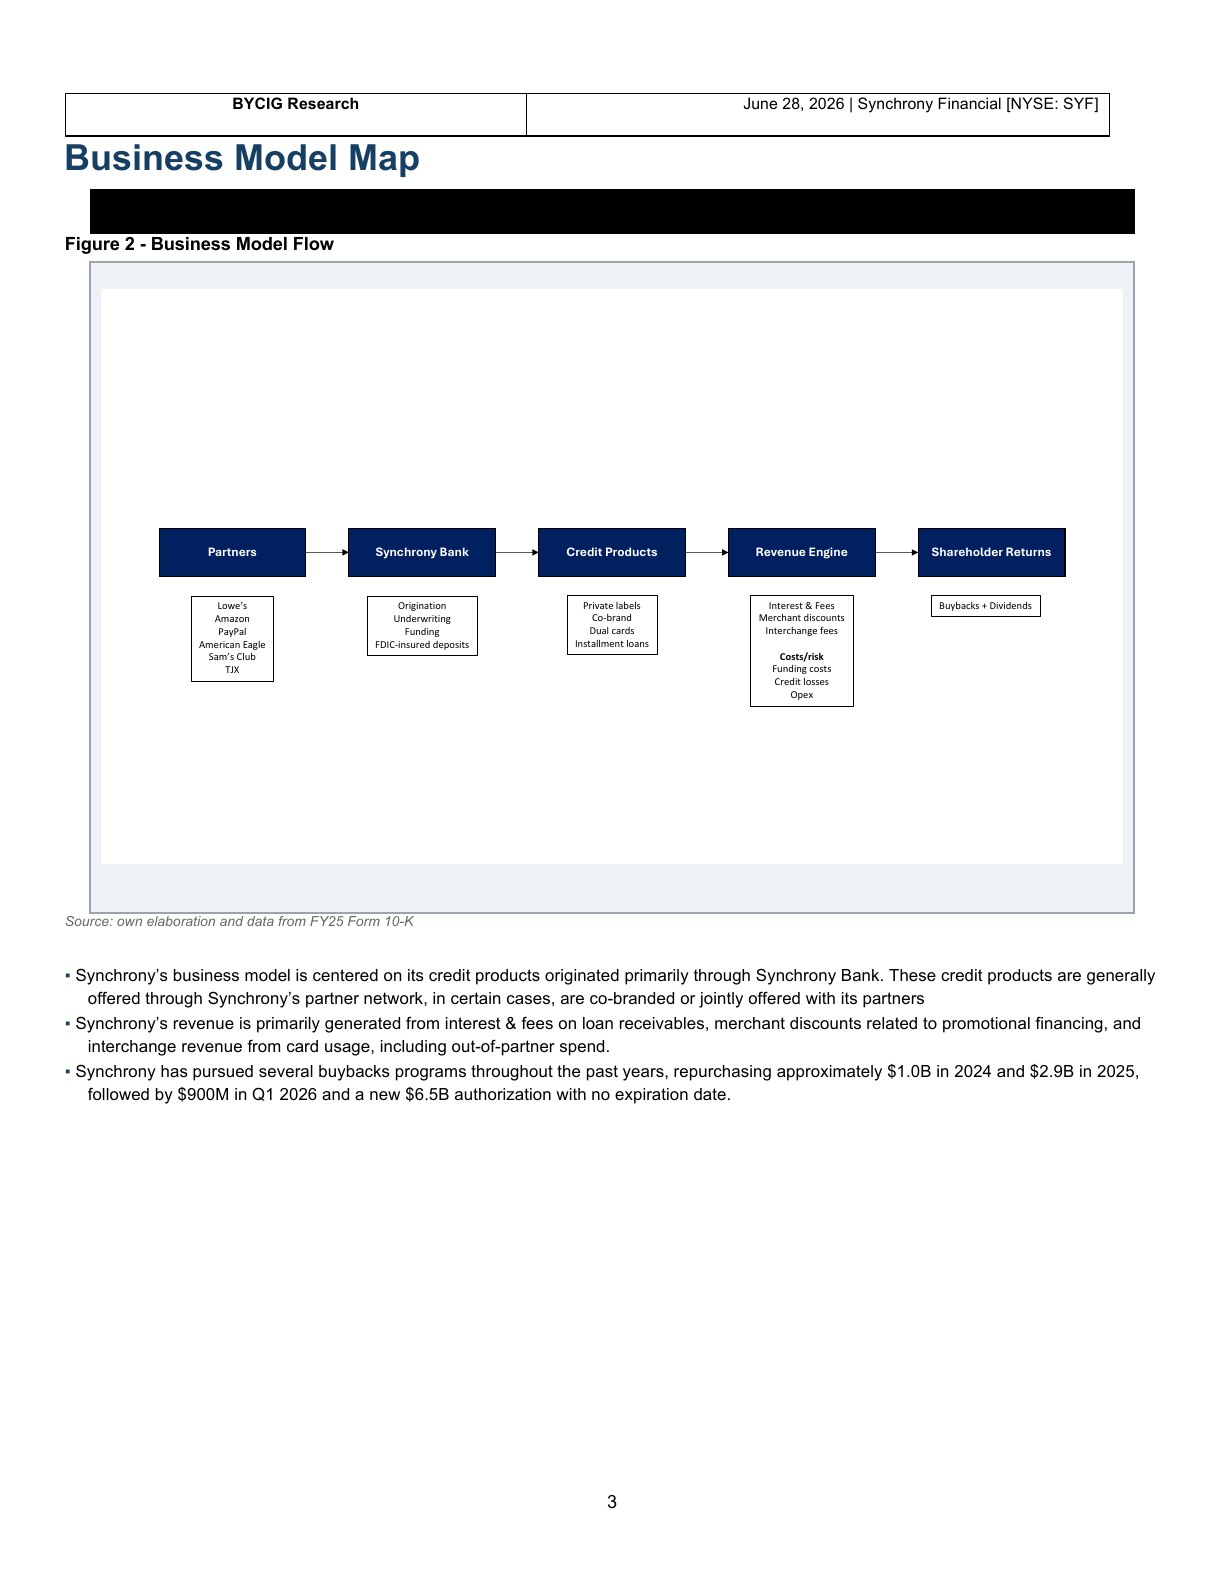
Figure 2 - Business Model Flow
Partners Synchrony Bank Credit Products Revenue Engine Shareholder Returns
Lowe’s Origination Private labels Interest & Fees Buybacks + Dividends
Amazon Underwriting Co-brand Merchant discounts
PayPal Funding Dual cards Interchange fees
American Eagle FDIC-insured deposits Installment loans
Sam’s Club Costs/risk
TJX Funding costs
Credit losses
Opex
Source: own elaboration and data from FY25 Form 10-K
▪ Synchrony’s business model is centered on its credit products originated primarily through Synchrony Bank. These credit products are generally
offered through Synchrony’s partner network, in certain cases, are co-branded or jointly offered with its partners
▪ Synchrony’s revenue is primarily generated from interest & fees on loan receivables, merchant discounts related to promotional financing, and
interchange revenue from card usage, including out-of-partner spend.
▪ Synchrony has pursued several buybacks programs throughout the past years, repurchasing approximately $1.0B in 2024 and $2.9B in 2025,
followed by $900M in Q1 2026 and a new $6.5B authorization with no expiration date.
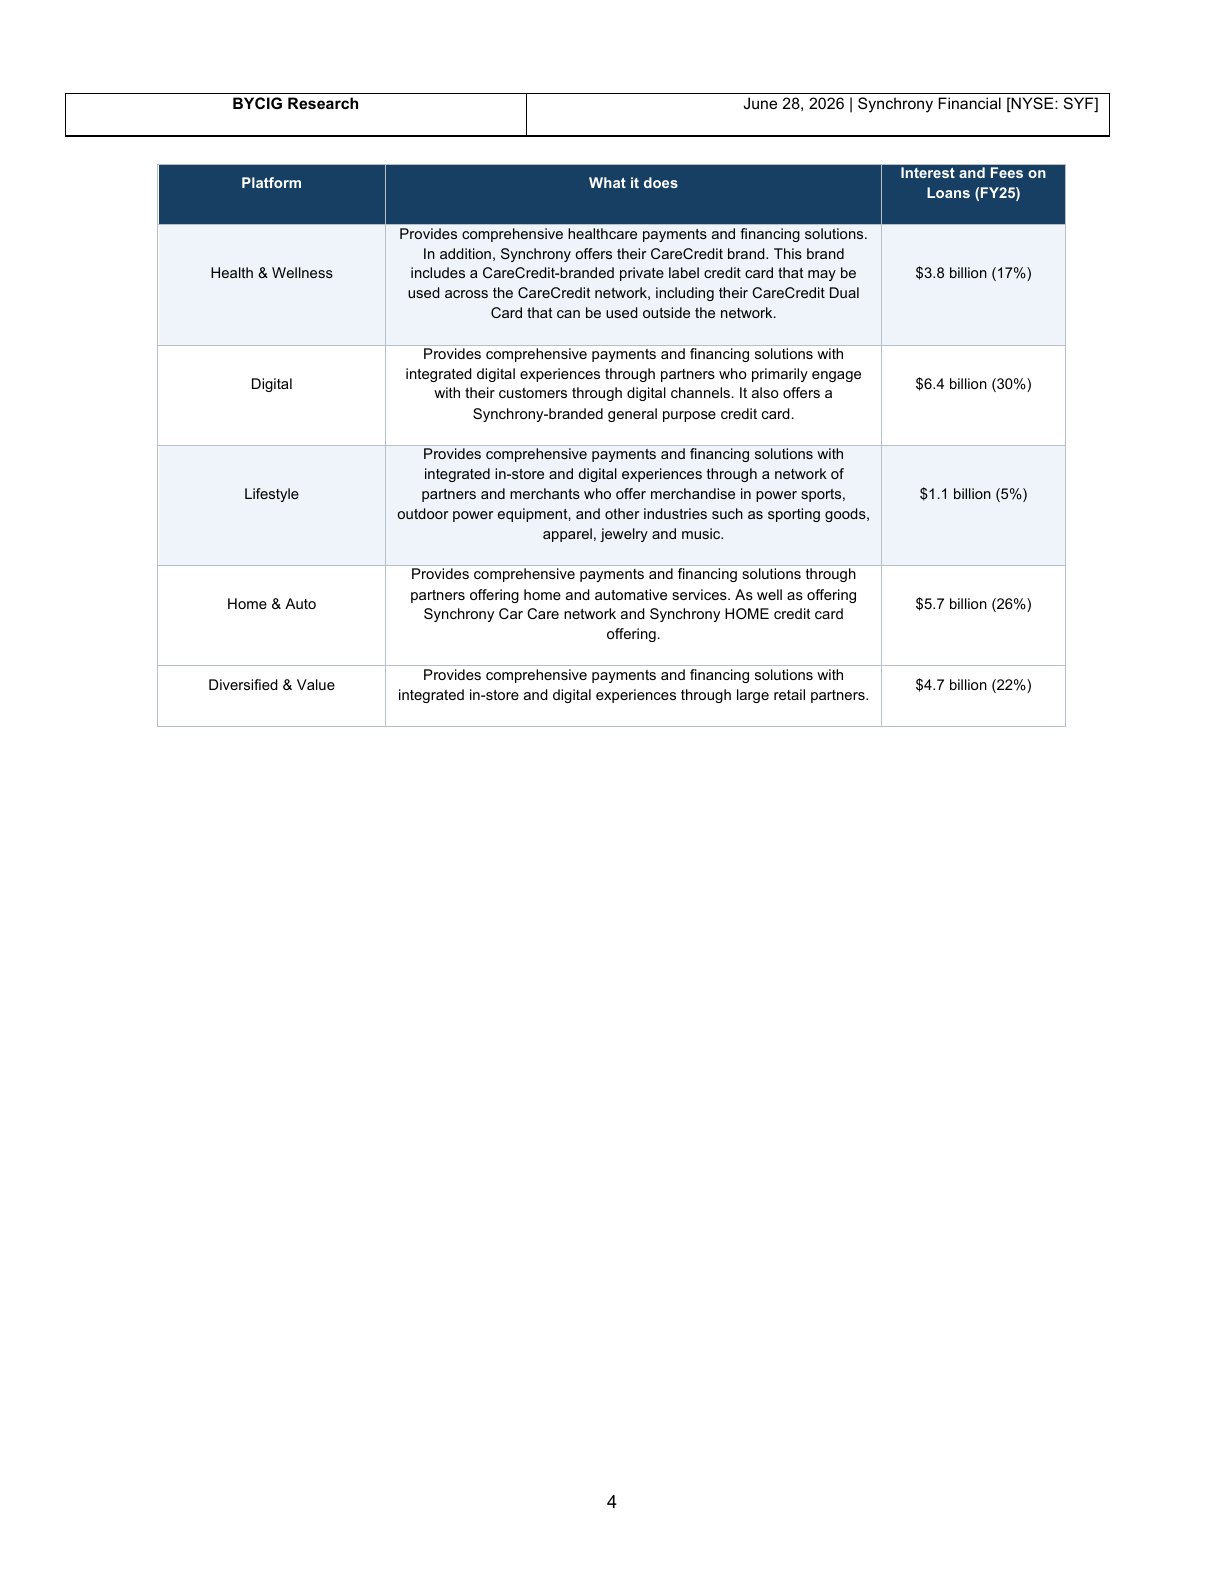
Interest and Fees on
Platform What it does
Loans (FY25)
Provides comprehensive healthcare payments and financing solutions.
In addition, Synchrony offers their CareCredit brand. This brand
Health & Wellness includes a CareCredit-branded private label credit card that may be $3.8 billion (17%)
used across the CareCredit network, including their CareCredit Dual
Card that can be used outside the network.
Provides comprehensive payments and financing solutions with
integrated digital experiences through partners who primarily engage
Digital $6.4 billion (30%)
with their customers through digital channels. It also offers a
Synchrony-branded general purpose credit card.
Provides comprehensive payments and financing solutions with
integrated in-store and digital experiences through a network of
Lifestyle partners and merchants who offer merchandise in power sports, $1.1 billion (5%)
outdoor power equipment, and other industries such as sporting goods,
apparel, jewelry and music.
Provides comprehensive payments and financing solutions through
partners offering home and automative services. As well as offering
Home & Auto $5.7 billion (26%)
Synchrony Car Care network and Synchrony HOME credit card
offering.
Provides comprehensive payments and financing solutions with
Diversified & Value $4.7 billion (22%)
integrated in-store and digital experiences through large retail partners.
Volume, Receivables and Revenue Mechanics
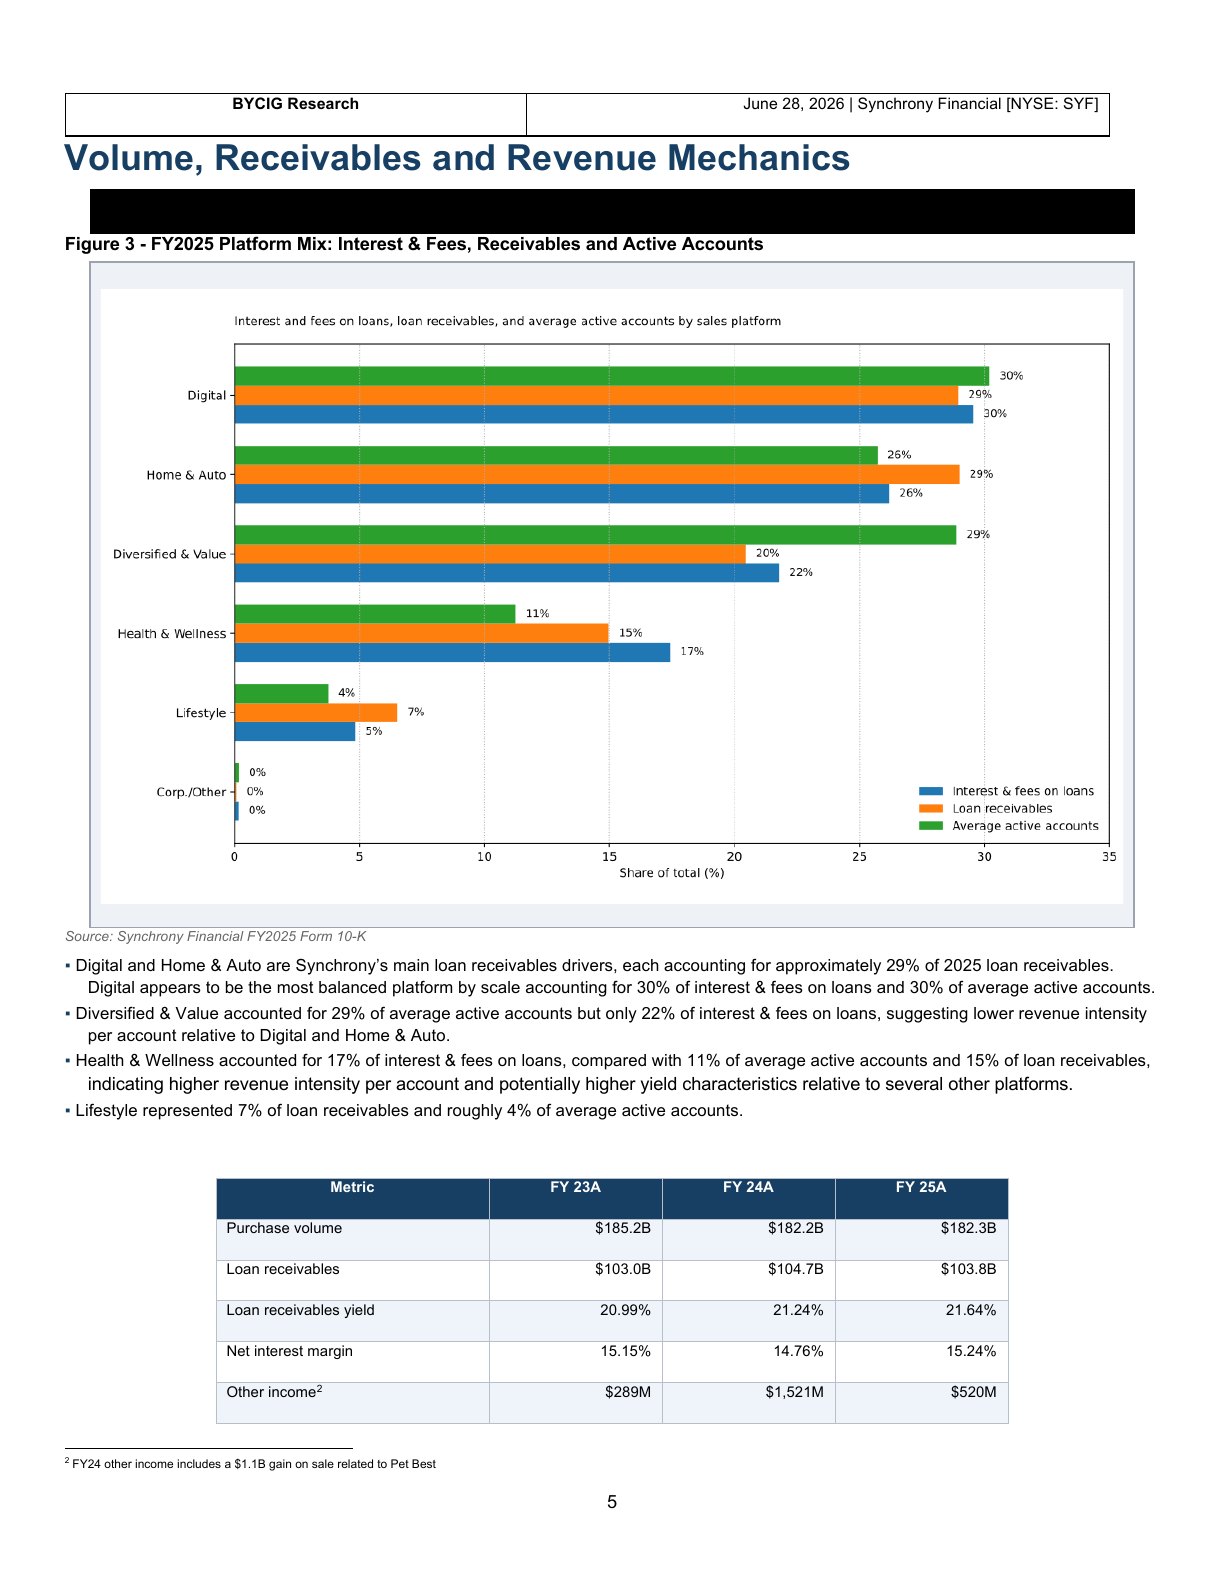
Figure 3 - FY2025 Platform Mix: Interest & Fees, Receivables and Active Accounts
Source: Synchrony Financial FY2025 Form 10-K
▪ Digital and Home & Auto are Synchrony’s main loan receivables drivers, each accounting for approximately 29% of 2025 loan receivables.
Digital appears to be the most balanced platform by scale accounting for 30% of interest & fees on loans and 30% of average active accounts.
▪ Diversified & Value accounted for 29% of average active accounts but only 22% of interest & fees on loans, suggesting lower revenue intensity
per account relative to Digital and Home & Auto.
▪ Health & Wellness accounted for 17% of interest & fees on loans, compared with 11% of average active accounts and 15% of loan receivables,
indicating higher revenue intensity per account and potentially higher yield characteristics relative to several other platforms.
▪ Lifestyle represented 7% of loan receivables and roughly 4% of average active accounts.
Metric FY 23A FY 24A FY 25A
Purchase volume $185.2B $182.2B $182.3B
Loan receivables $103.0B $104.7B $103.8B
Loan receivables yield 20.99% 21.24% 21.64%
Net interest margin 15.15% 14.76% 15.24%
Other income2 $289M $1,521M $520M
FY24 other income includes a $1.1B gain on sale related to Pet Best
Credit Performance
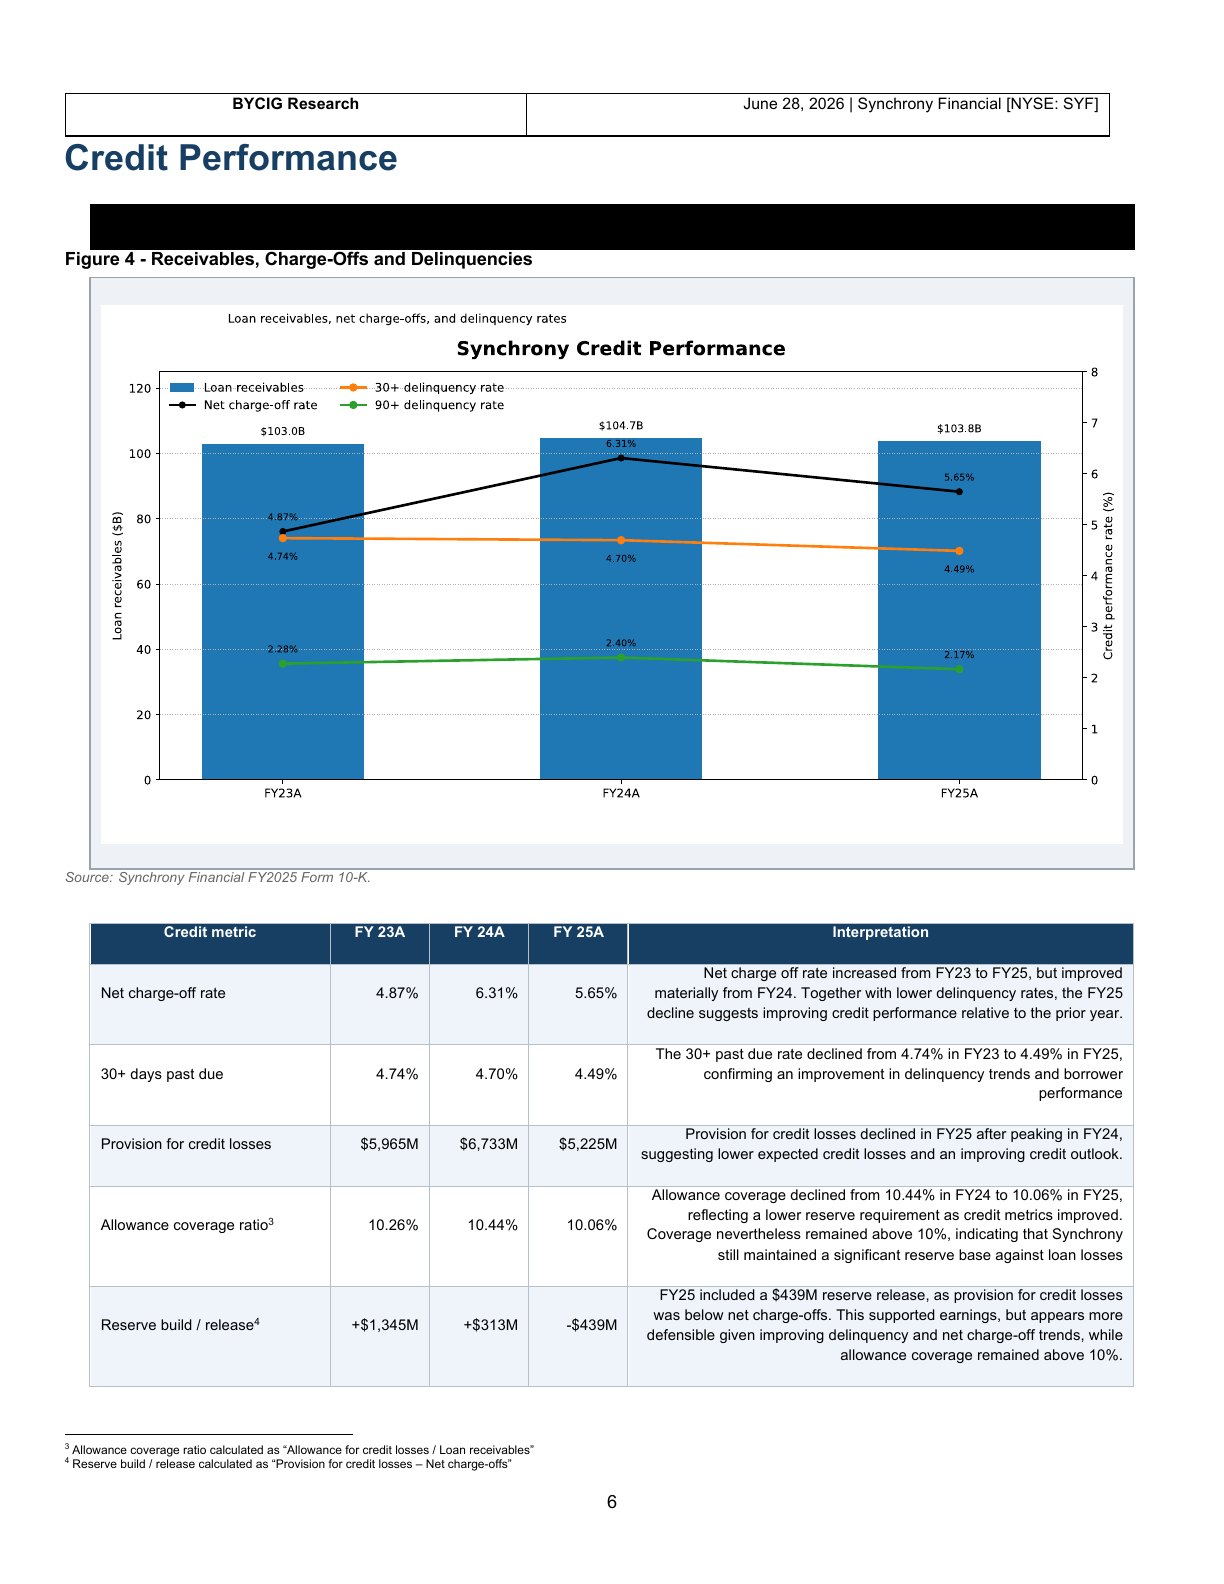
Figure 4 - Receivables, Charge-Offs and Delinquencies
Source: Synchrony Financial FY2025 Form 10-K.
Credit metric FY 23A FY 24A FY 25A Interpretation
Net charge off rate increased from FY23 to FY25, but improved
Net charge-off rate 4.87% 6.31% 5.65% materially from FY24. Together with lower delinquency rates, the FY25
decline suggests improving credit performance relative to the prior year.
The 30+ past due rate declined from 4.74% in FY23 to 4.49% in FY25,
30+ days past due 4.74% 4.70% 4.49% confirming an improvement in delinquency trends and borrower
performance
Provision for credit losses declined in FY25 after peaking in FY24,
Provision for credit losses $5,965M $6,733M $5,225M
suggesting lower expected credit losses and an improving credit outlook.
Allowance coverage declined from 10.44% in FY24 to 10.06% in FY25,
reflecting a lower reserve requirement as credit metrics improved.
Allowance coverage ratio3 10.26% 10.44% 10.06%
Coverage nevertheless remained above 10%, indicating that Synchrony
still maintained a significant reserve base against loan losses
FY25 included a $439M reserve release, as provision for credit losses
was below net charge-offs. This supported earnings, but appears more
Reserve build / release4 +$1,345M +$313M -$439M
defensible given improving delinquency and net charge-off trends, while
allowance coverage remained above 10%.
Allowance coverage ratio calculated as “Allowance for credit losses / Loan receivables”
Reserve build / release calculated as “Provision for credit losses – Net charge-offs”
Funding, Liquidity and Regulatory Capital
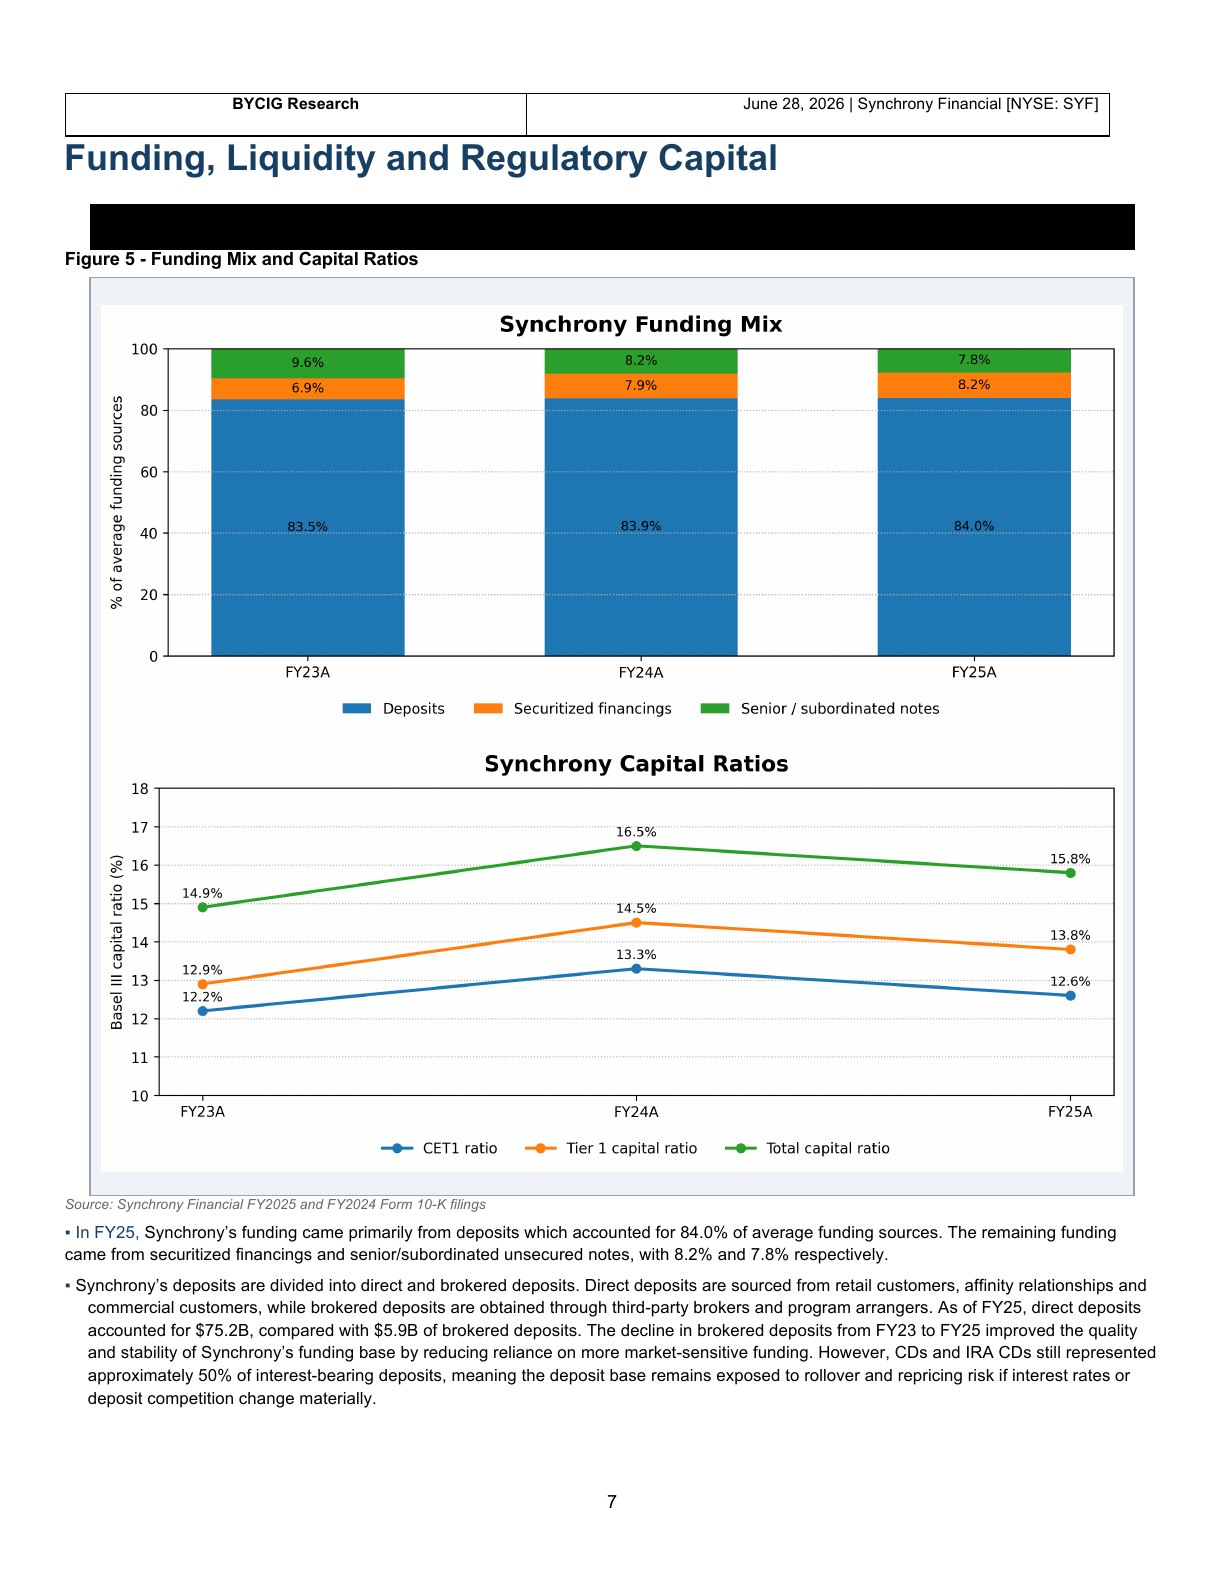
Figure 5 - Funding Mix and Capital Ratios
Source: Synchrony Financial FY2025 and FY2024 Form 10-K filings
▪ In FY25, Synchrony’s funding came primarily from deposits which accounted for 84.0% of average funding sources. The remaining funding
came from securitized financings and senior/subordinated unsecured notes, with 8.2% and 7.8% respectively.
▪ Synchrony’s deposits are divided into direct and brokered deposits. Direct deposits are sourced from retail customers, affinity relationships and
commercial customers, while brokered deposits are obtained through third-party brokers and program arrangers. As of FY25, direct deposits
accounted for $75.2B, compared with $5.9B of brokered deposits. The decline in brokered deposits from FY23 to FY25 improved the quality
and stability of Synchrony’s funding base by reducing reliance on more market-sensitive funding. However, CDs and IRA CDs still represented
approximately 50% of interest-bearing deposits, meaning the deposit base remains exposed to rollover and repricing risk if interest rates or
deposit competition change materially.
▪ Synchrony also maintains a liquidity portfolio and access to external liquidity. As of Dec. 31, 2025, the Company had $10.0B of available
borrowing capacity through the Federal Reserve discount window and $2.6B of undrawn securitized financing capacity. As of Mar 31, 2026,
that discount window increased to $10.4B.
▪ Synchrony Financial is a savings and loan holding company, and its principal banking subsidiary is Synchrony Bank. As a result, it must comply
with regulatory capital rules under the U.S Basel III Standardized Approach. Synchrony Financial reported a CET1 ratio of 12.6% in FY25, well
above the 4.5% minimum capital adequacy requirement. Synchrony Financial’s CET1 ratio declined from 13.3% in FY24 to 12.6% in FY25,
primarily due to share repurchases, common and preferred dividends, and the final CECL regulatory capital phase-in, partially offset by net
earnings
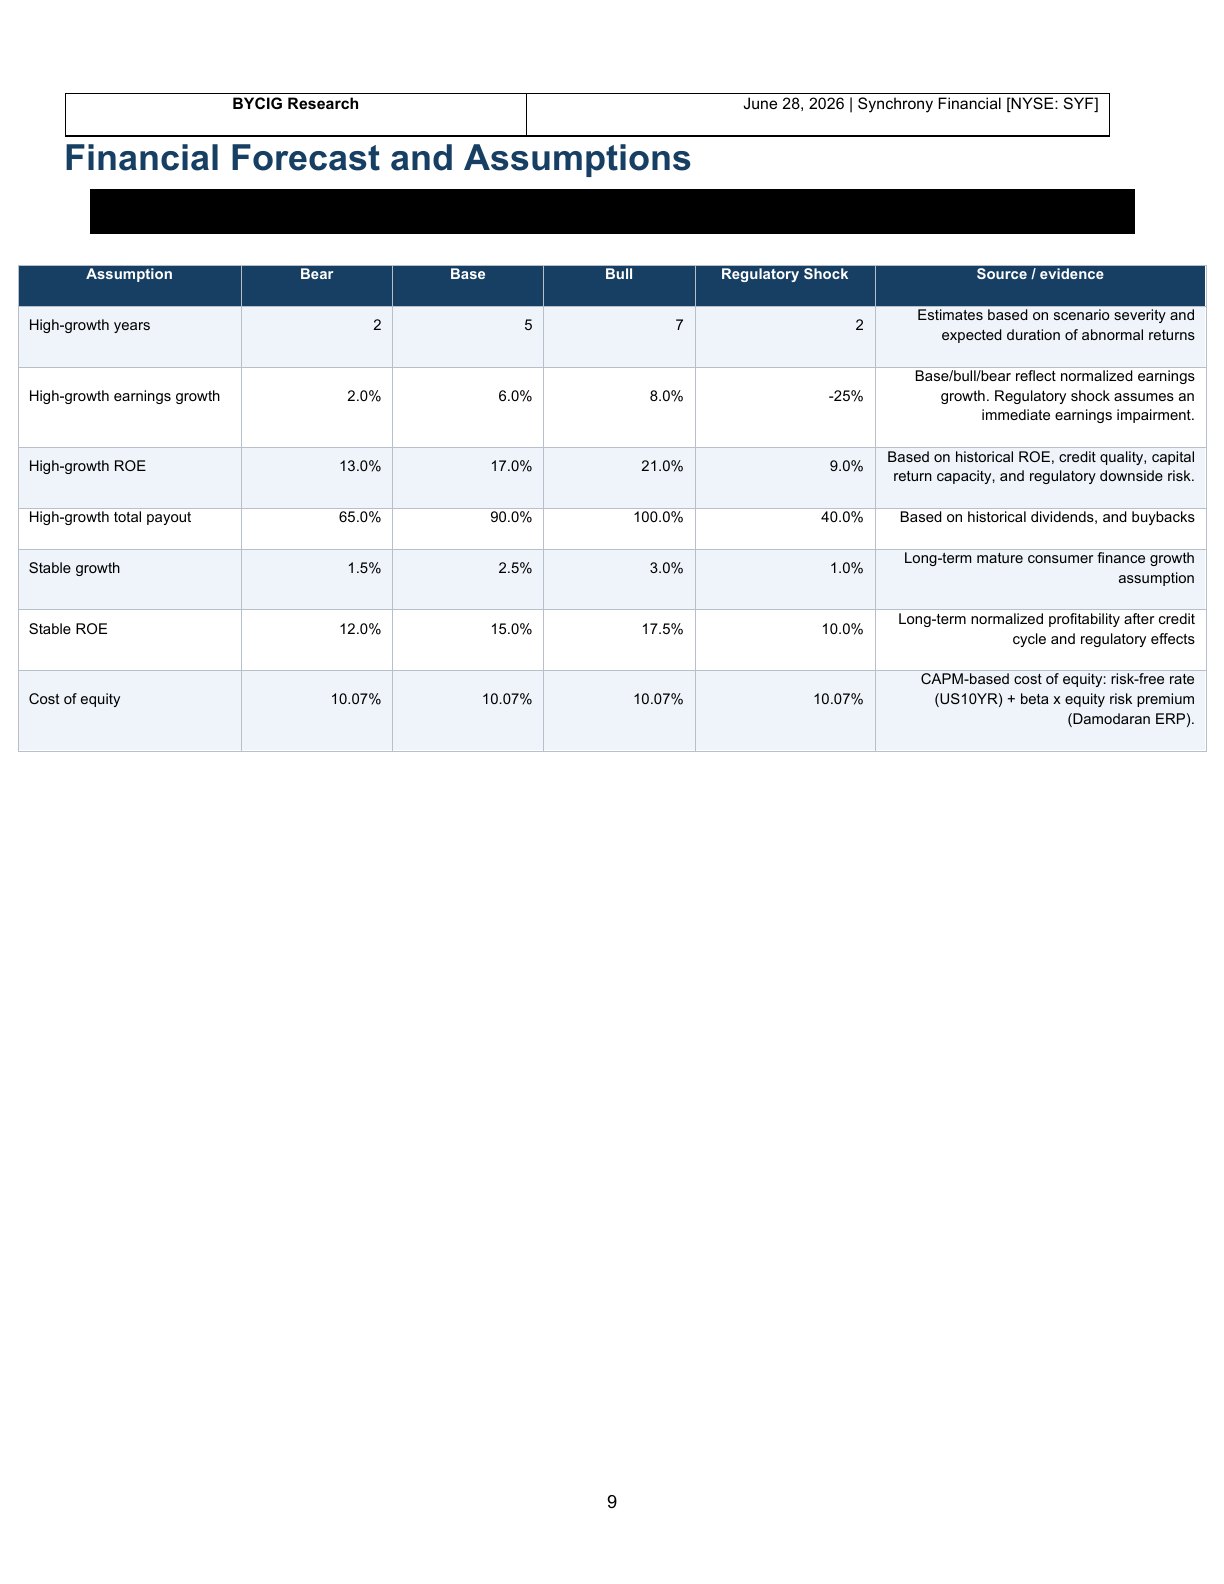
Financial Forecast and Assumptions
Assumption Bear Base Bull Regulatory Shock Source / evidence
Estimates based on scenario severity and
High-growth years 2 5 7 2
expected duration of abnormal returns
Base/bull/bear reflect normalized earnings
High-growth earnings growth 2.0% 6.0% 8.0% -25% growth. Regulatory shock assumes an
immediate earnings impairment.
Based on historical ROE, credit quality, capital
High-growth ROE 13.0% 17.0% 21.0% 9.0%
return capacity, and regulatory downside risk.
High-growth total payout 65.0% 90.0% 100.0% 40.0% Based on historical dividends, and buybacks
Long-term mature consumer finance growth
Stable growth 1.5% 2.5% 3.0% 1.0%
assumption
Long-term normalized profitability after credit
Stable ROE 12.0% 15.0% 17.5% 10.0%
cycle and regulatory effects
CAPM-based cost of equity: risk-free rate
Cost of equity 10.07% 10.07% 10.07% 10.07% (US10YR) + beta x equity risk premium
(Damodaran ERP).
Valuation Summary
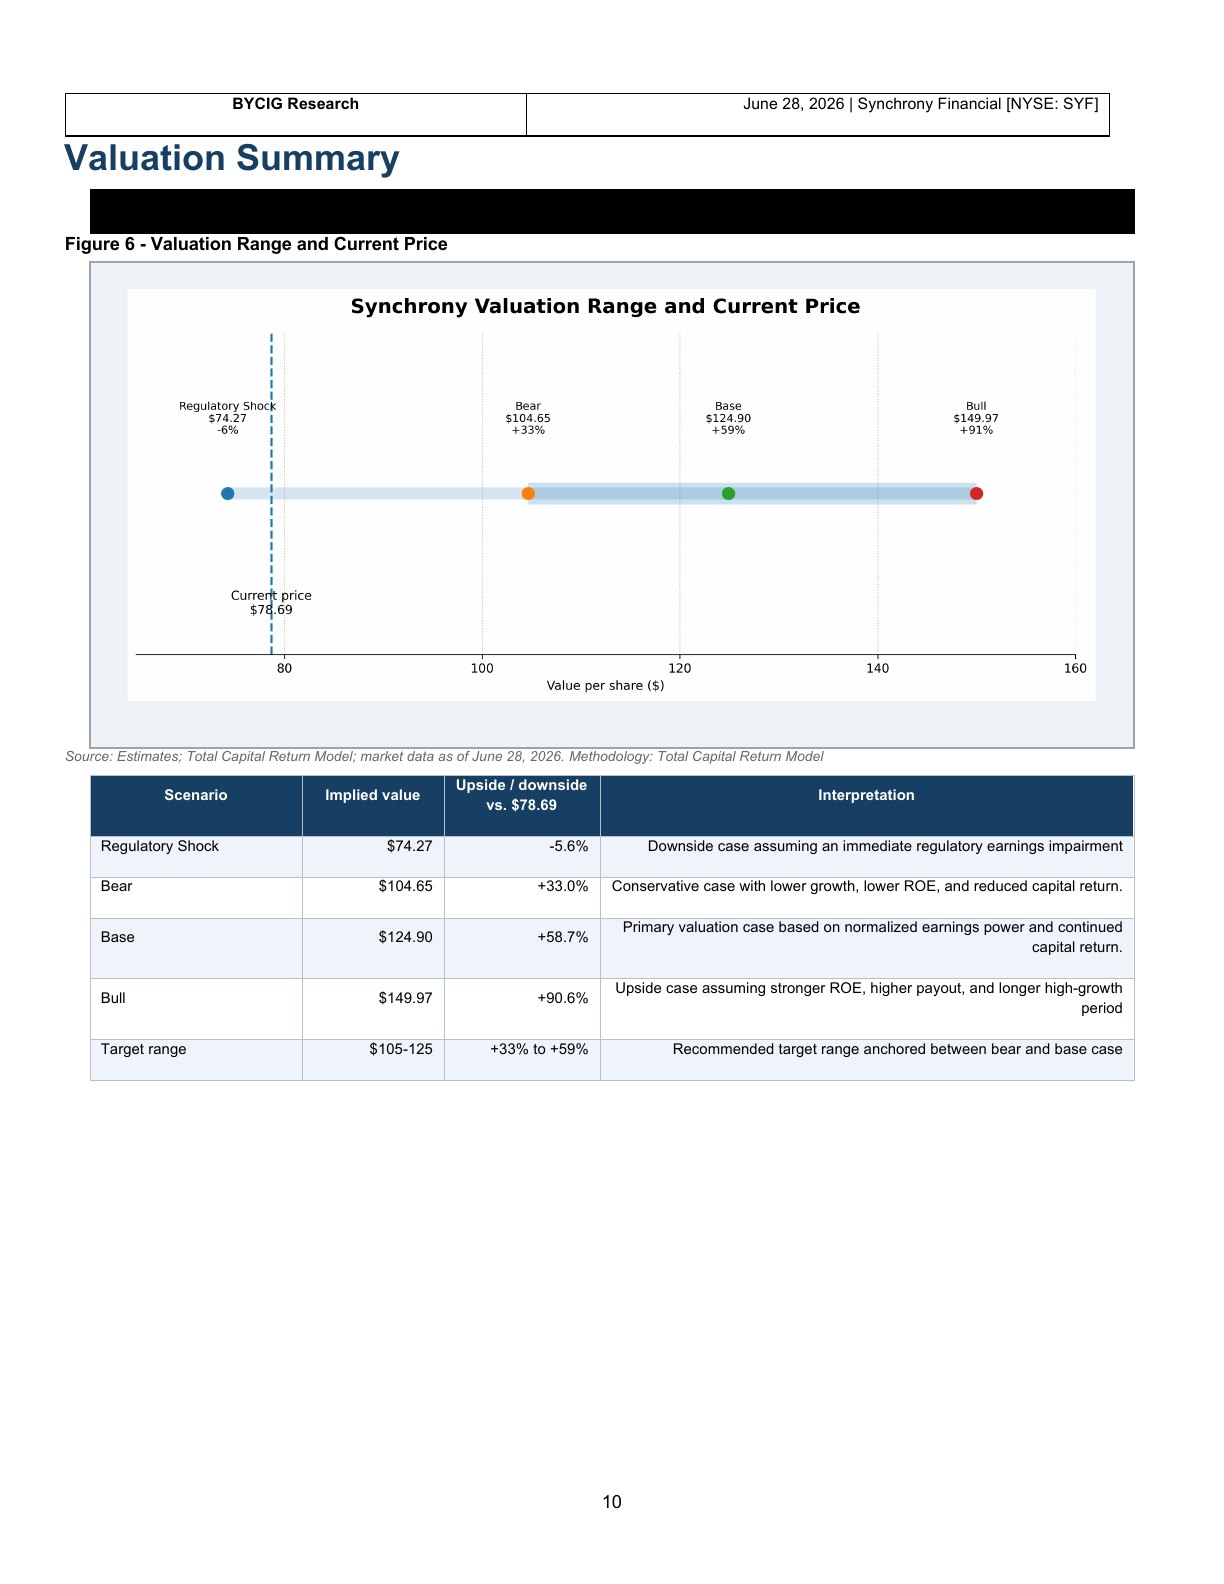
Figure 6 - Valuation Range and Current Price
Source: Estimates; Total Capital Return Model; market data as of June 28, 2026. Methodology: Total Capital Return Model
Upside / downside
Scenario Implied value Interpretation
vs. $78.69
Regulatory Shock $74.27 -5.6% Downside case assuming an immediate regulatory earnings impairment
Bear $104.65 +33.0% Conservative case with lower growth, lower ROE, and reduced capital return.
Primary valuation case based on normalized earnings power and continued
Base $124.90 +58.7%
capital return.
Upside case assuming stronger ROE, higher payout, and longer high-growth
Bull $149.97 +90.6%
period
Target range $105-125 +33% to +59% Recommended target range anchored between bear and base case
Total Capital Return Model
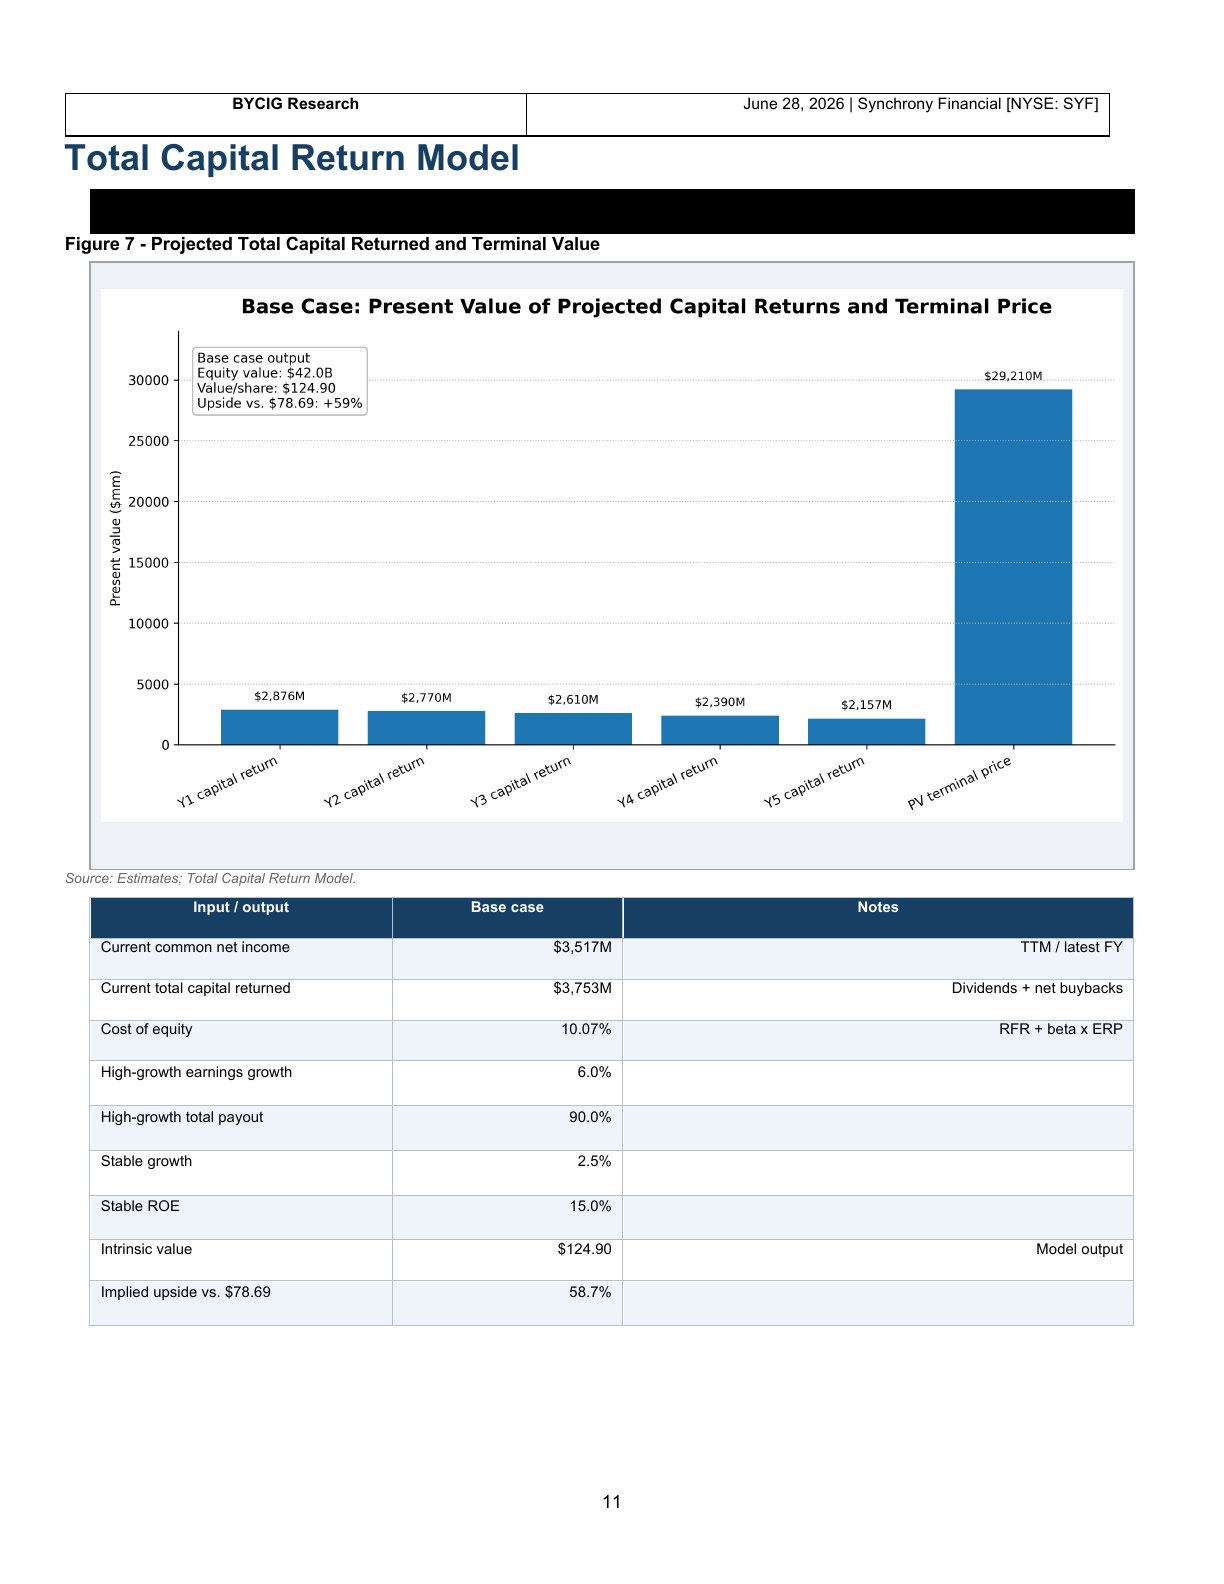
Figure 7 - Projected Total Capital Returned and Terminal Value
Source: Estimates; Total Capital Return Model.
Input / output Base case Notes
Current common net income $3,517M TTM / latest FY
Current total capital returned $3,753M Dividends + net buybacks
Cost of equity 10.07% RFR + beta x ERP
High-growth earnings growth 6.0%
High-growth total payout 90.0%
Stable growth 2.5%
Stable ROE 15.0%
Intrinsic value $124.90 Model output
Implied upside vs. $78.69 58.7%
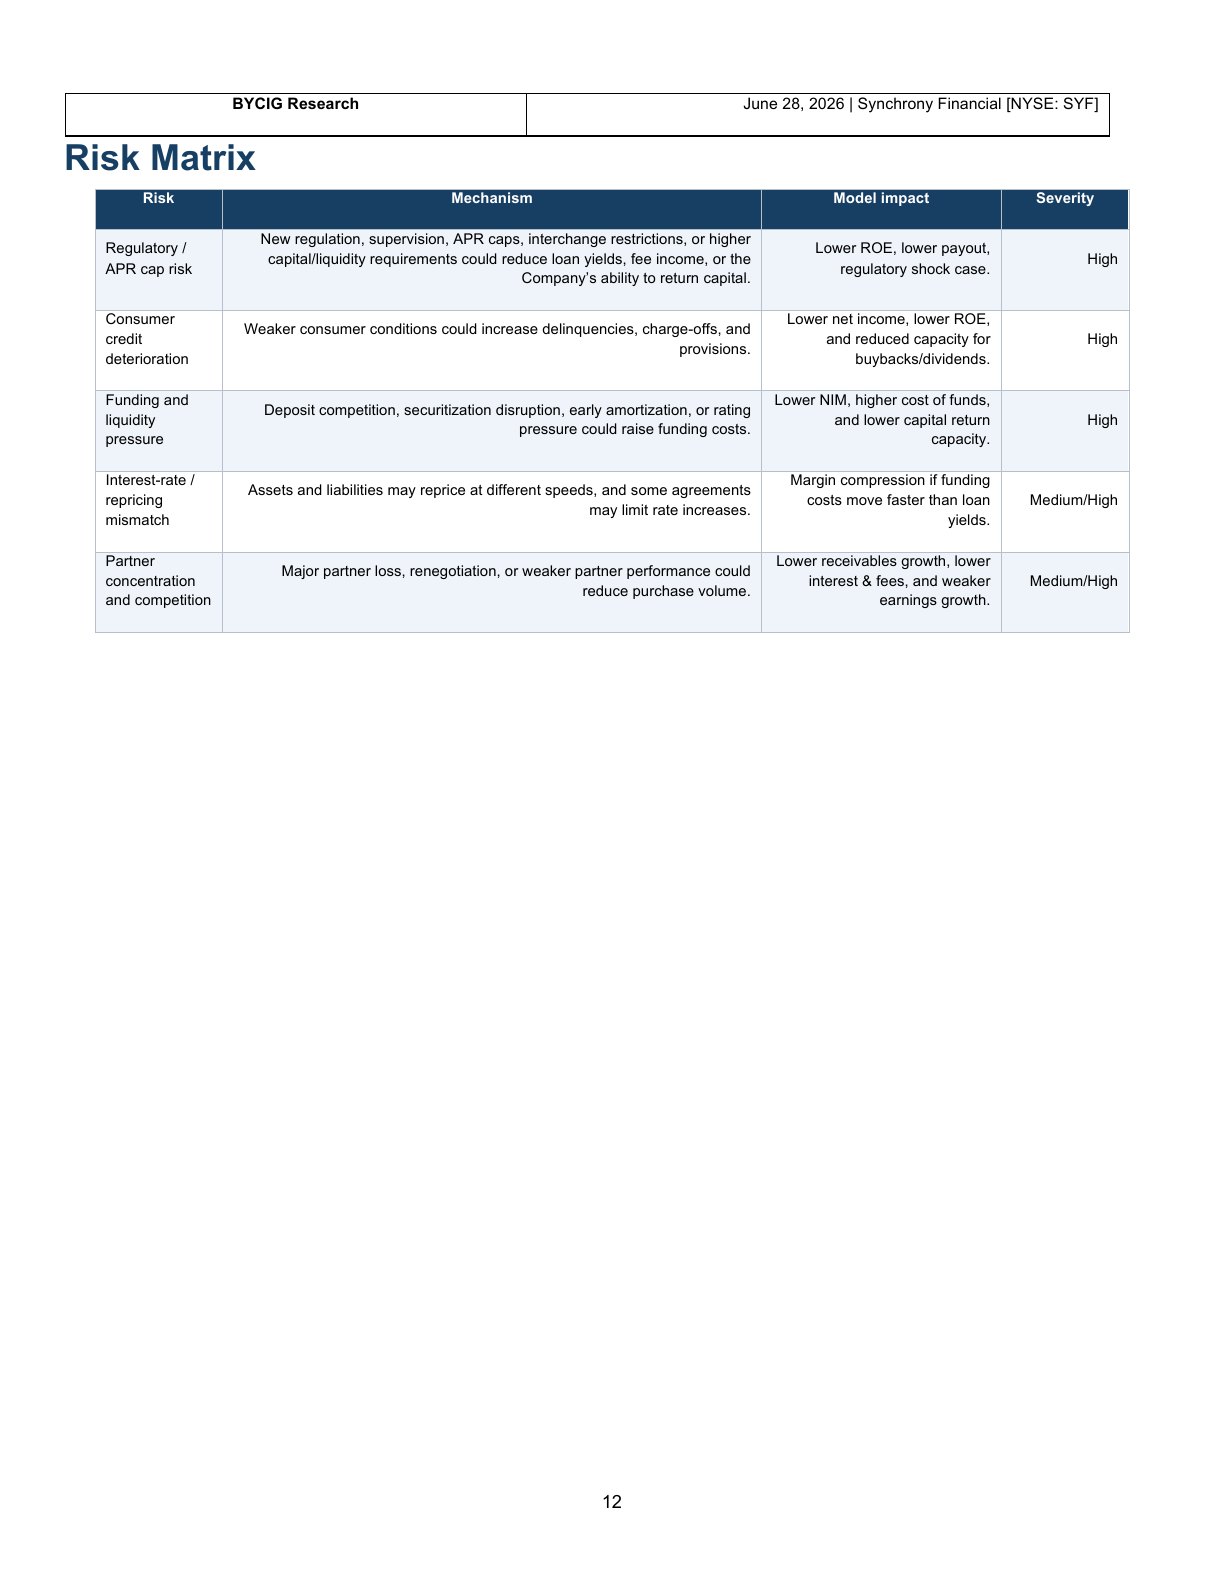
Risk Matrix
Risk Mechanism Model impact Severity
New regulation, supervision, APR caps, interchange restrictions, or higher
Regulatory / Lower ROE, lower payout,
capital/liquidity requirements could reduce loan yields, fee income, or the High
APR cap risk regulatory shock case.
Company’s ability to return capital.
Consumer Lower net income, lower ROE,
Weaker consumer conditions could increase delinquencies, charge-offs, and
credit and reduced capacity for High
provisions.
deterioration buybacks/dividends.
Funding and Lower NIM, higher cost of funds,
Deposit competition, securitization disruption, early amortization, or rating
liquidity and lower capital return High
pressure could raise funding costs.
pressure capacity.
Interest-rate / Margin compression if funding
Assets and liabilities may reprice at different speeds, and some agreements
repricing costs move faster than loan Medium/High
may limit rate increases.
mismatch yields.
Partner Lower receivables growth, lower
Major partner loss, renegotiation, or weaker partner performance could
concentration interest & fees, and weaker Medium/High
reduce purchase volume.
and competition earnings growth.
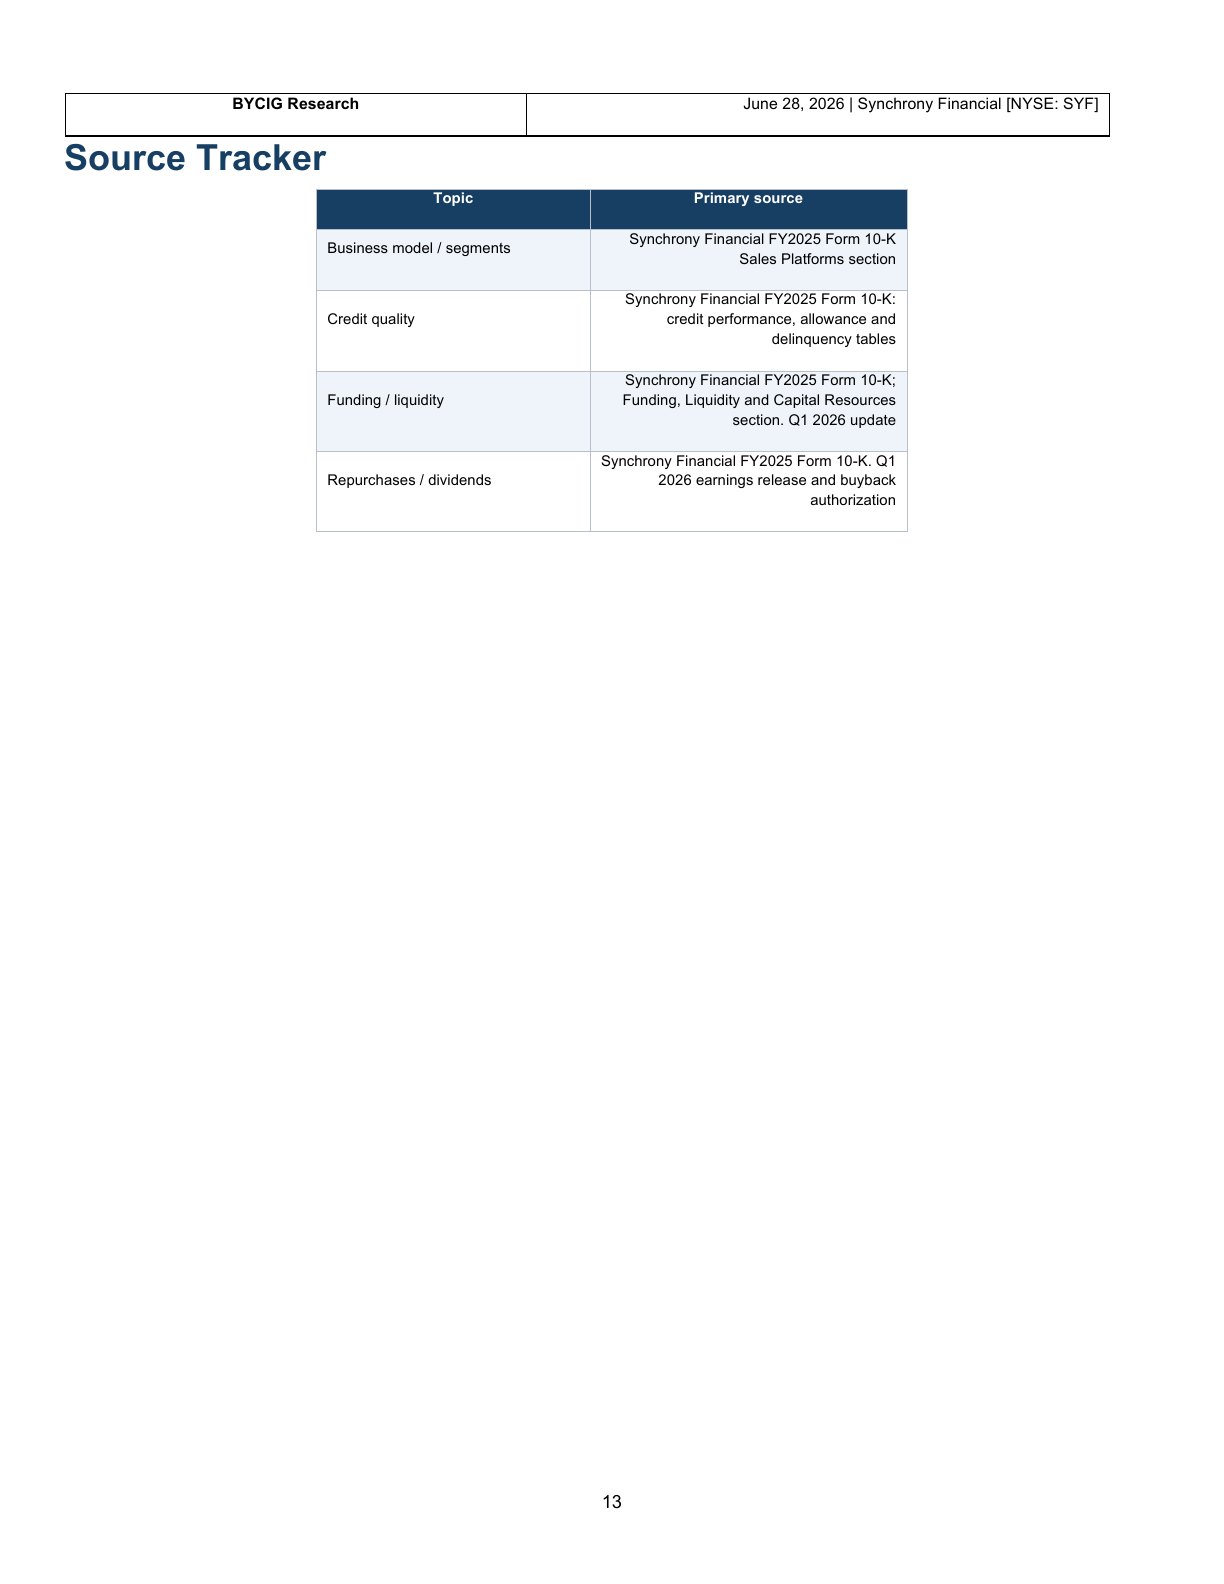
Source Tracker
Topic Primary source
Synchrony Financial FY2025 Form 10-K
Business model / segments
Sales Platforms section
Synchrony Financial FY2025 Form 10-K:
Credit quality credit performance, allowance and
delinquency tables
Synchrony Financial FY2025 Form 10-K;
Funding / liquidity Funding, Liquidity and Capital Resources
section. Q1 2026 update
Synchrony Financial FY2025 Form 10-K. Q1
Repurchases / dividends 2026 earnings release and buyback
authorization